목차
Categorical data
Data that is divided into a limited number of qualitative groups
어떠한 기준에 의해 분류되는 데이터이다.
데이터분석에서는 카테고리테이터를 numerical data, 숫자형 데이터로 바꾸는 작업이 많이 필요하다.
그 방법에 대해 알아보자. 숫자형 데이터로 바꾸는 것이 저장용량도 줄이고, 속도를 빠르게 해주는 등 작업을 효율적으로 바꾸어준다.
1) Label encoding
Data transformation technique where each category is assigned a unique number instead of a qualitative value.
각 변수에 질적인 양을 할당하는 것이 아니라, 각각의 고유한 숫자를 넘버링하는 방식이다.

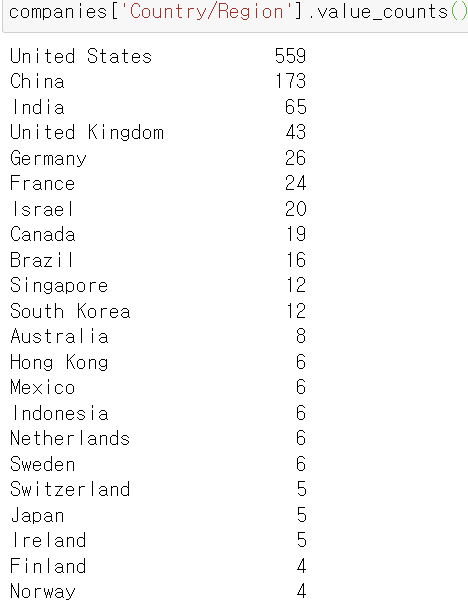
★ value_counts()
고유한 값 확인하기


★ pd.Categorical()
데이터를 카테고리컬하게 만들어주는 함수이다.
# Create categorical designations
months = ['Jan', 'Feb', 'Mar', 'Apr', 'May', 'Jun', 'Jul', 'Aug', 'Sep', 'Oct', 'Nov', 'Dec']

# Encode `month` column as categoricals
df['month'] = pd.Categorical(df['month'], categories=months, ordered=True)

# Create `year` column by extracting the year info from the datetime object
df['year'] = df['date'].dt.strftime('%Y')

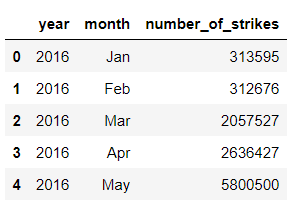
# Create a new df of month, year, total strikes
df_by_month = df.groupby(['year', 'month']).sum().reset_index()
df_by_month.head()
★ astype('category')
카테고리로 바꾸기
companies['Country/Region'].astype('category')companies['Country/Region'].astype('category').cat.codes
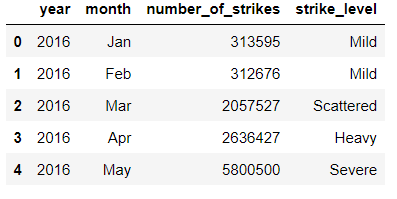
★ pd.qcut()
데이터를 bin(분위)으로 동등하게 나누는 함수이다.
# Create a new column that categorizes number_of_strikes into 1 of 4 categories
df_by_month['strike_level'] = pd.qcut(
    df_by_month['number_of_strikes'],
    4,
    labels = ['Mild', 'Scattered', 'Heavy', 'Severe'])
df_by_month.head()
★ .cat.codes
pd에서 categorical data를 컴퓨터가 처리하기 쉽도록 정수형으로 변환하는 속성이다.
# Create new column representing numerical value of strike level
df_by_month['strike_level_code'] = df_by_month['strike_level'].cat.codes
df_by_month.head()
★ replace
companies['Continent'].value_counts()
continent_dict={'North America':1, 'Asia':2, 'Europe':3, 'South America':4, 'Oceania': 5, 'Africa':6}
companies['Continent']=companies['Continent'].replace(continent_dict)

2) Dummy variables
Variables with values of 0 or 1, which indicate the presence or absence of something.
0과 1로만 이루어진 변수를 말한다. 머신러닝 알고리즘에서 유용하게 쓰인다.

★ get_dummies()
카테고리컬 데이터를 0,1로만 이루어진 numerical한 데이터로 바꿔준다.
pd.get_dummies(df_by_month['strike_level'])
데이터 시각화
데이터를 시각화해서 보면, 더욱 유의미한 해석을 하기 쉬워진다.
★ pivot()
pivot()함수는 pd에서 사용되는 데이터 변형 함수 중 하나로, df의 열을 행 인덱스, 행을 열 인덱스로 변환하여 데이터를 재구성한다. pivot함수를 이용해 데이터를 재구성하면 seaborn 등의 시각화 도구를 사용하여 히트맵, 막대 그래프, 선 그래프 등 다양한 시각화를 수행하기 쉬워진다.
index, columns, values의 파라미터에 어떤 것을 뽑아서 pivot을 만들지 적어준다.
# Create new df that pivots the data
df_by_month_plot = df_by_month.pivot(index='year', columns='month', values='strike_level_code')
df_by_month_plot.head()
★heatmap
히트맵을 만든다.
ax = sns.heatmap(df_by_month_plot, cmap = 'Blues')
colorbar = ax.collections[0].colorbar
colorbar.set_ticks([0, 1, 2, 3])
colorbar.set_ticklabels(['Mild', 'Scattered', 'Heavy', 'Severe'])
plt.show()
데이터분석, 데이터교육, 카테고리컬데이터를 숫자형데이터로, 데분기
'Certificate > data analytics-Google' 카테고리의 다른 글
| 데이터 시각화- 어떤 그래프를 써야할까? (0) | 2023.07.11 |
|---|---|
| Input validation, validate data, EDA, label encoding, dummy encoding, duplicated(), drop_duplicates(), replace, loc (0) | 2023.07.11 |
| Outlier, 이상치 처리하기, global, contextual, collective outliers, (0) | 2023.07.10 |
| Missing Data 처리하기, isnull, isna, fillna, dropna, any, drop_duplicated (0) | 2023.07.10 |
| Understanding data format, structuring data (0) | 2023.07.07 |