목차
Plan > Analyze > Construct > Excute
1.PACE
1. Plan
Understand your data in the problem context
contextualize&understand the data and the problem
데이터는 어떻게 모아졌고, 요구하는 것이 무엇인지
나머지 단계에 앞서서 전체적인 아웃라인을 계획해본다.
2. Analyze
EDA, check model assumptions & select model
Determine if we should move forward with building the model
EDA 등 데이터를 좀더 분석해서 사용할 적당한 모델을 가정한다.
데이터에 대한 정확하고 통계적인 분석은 더 나은 모델을 구성하는데 도움이 된다.
Model assumptions
Statements about the data that must be true to justify the use of particular data science techniques.
3. Construct
Construcet & evaluate model
Determine how well your model fits the data.
변수를 정하고, 데이터변환 등을 하면서 파이썬을 이용해서 모델을 만든다.
단, 모델을 가정했다하더라도 중간에 다른 모델로 바꿀 수 있다.
evaluate model
metrics, compare model 등을 이용해서 how good is my model? 에 대한 답을 찾는다.
그리고 모델을 정확하게 하기 위해 EDA를 이용해서 좀더 모델을 다듬어본다.
4. Execute
Interpret model and share story.
앞서 만든 것들을 시각화 등으로 효율적으로 사람들에게 알리는 과정이다.
데이터의 예시에 따라 어떤 모델을 사용하는 것이 좋을까?
예시1) 독립변수: 영향을 미치는 요소들 , 종속변수: 음악재생횟수
알고 싶은 것: 독립변수가 종속변수에 얼마나 영향을 미치는지
----> Linear regression
- Accessible interpretation
- Explain which factors impact the outcome variables
- Check model assumptions
예시2) 독립변수: 세 가지 종류의 원두, 종속변수:원두에 따른 커피 판매량
알고 싶은 것: 각각의 다른 그룹에 대해 종속변수가 어떻게 달라지는지
-----> Hypothesis testing
H0: 원두가 달라도 판매되는 양은 같다.
H1: 원두에 따라 판매되는 양이 다르다.
- Outcome variable is continuous
- Focus on comparing different groups
- reject or accept null hypothesis based on P-value and confidence level.
예시3) 독립변수: 이메일, 종속변수: 바이러스 먹은 것, 먹지 않은 것
알고 싶은 것: 이메일에 따라 어떤 것이 바이러스에 먹었는지, 아닌지 분별하는 것.
종속변수가 2가지의 값으로 이루어졌다.

Linear Regression
<요약>
1. Linear regression is a way to model linear relationships
2. Dependet variables vary according to independet variables
3. The slope identifies how much the dependent variable changes per one-unit change in the independent variable
4. Positive, nagative correlation describes linear relationships between variables
5. Correlation is not Causation
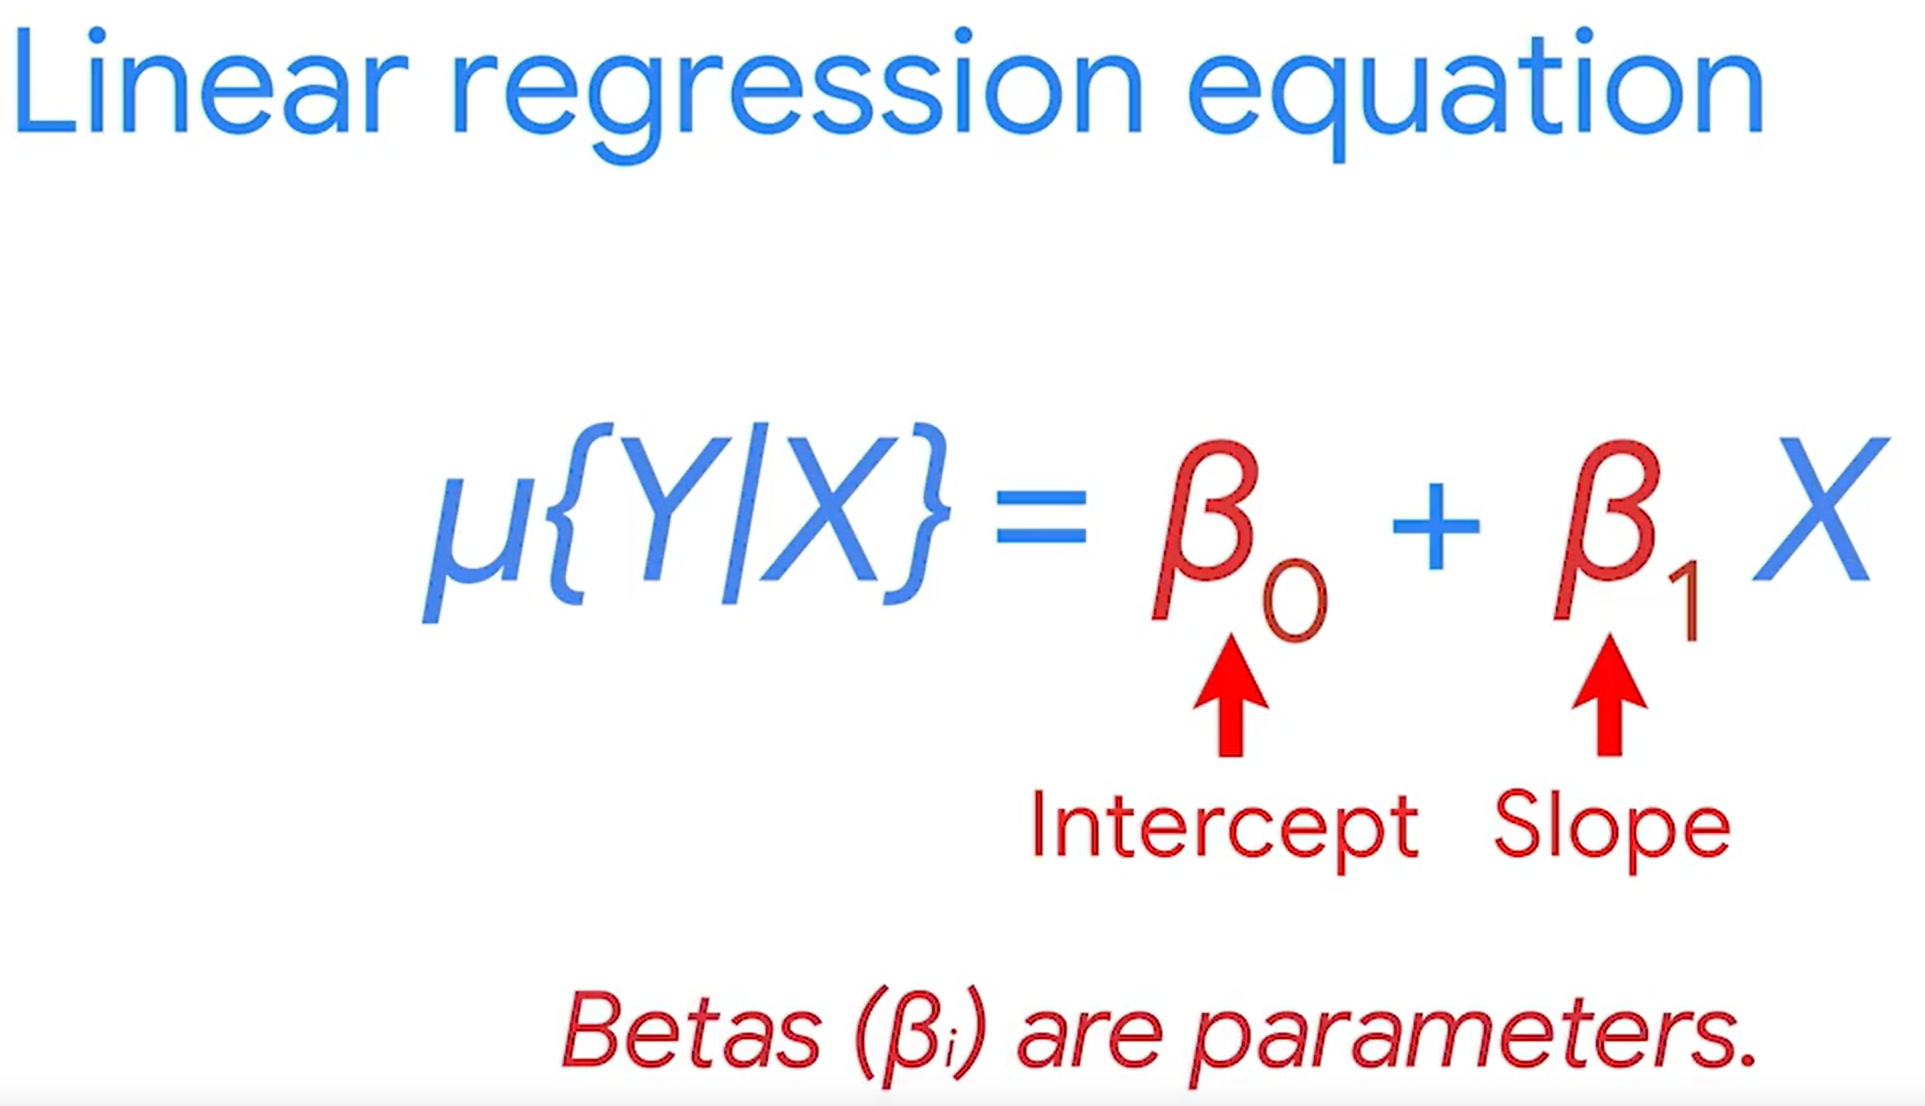
A technique that estimates the linear relationship between a continuous dependent variable and one or more independent variable.
일상에서 우리가 접하는 많은 것들은 선형 회귀로 나타내질 수 있다.
변수의 관계를 그래프에서 선으로 나타낸다는 것이다.
<개념>
★ Line
A collection of an infinite number of points extending in two opposite directions.
★ Continuous variables
Takes on any real value between minum and maximum value.
★ Categorical Variables
Have a finite number of possible values
★ dependent variable.=Y
= response or outcome variable
★ Independet variable=X
A variable that explains trends in the dependent variable
= explanatory or predictor variable.

★ Slope 기울기
The amount that y increases or decreases per one-nuit increase of x
★ intercept y절편
x가 0일 때 y의 값
★ Correlated
X값에 따라 Y값에 변화가 있을 때 Correlated 하다고 말한다.
얼마나 그 강도가 강한지도 계산할 수 있다.
+ Positive correlation
- Nagative correlation
★ 주의점
Correlation is not Causation.
연관성이 원인은 아니다.
★ Causation
A cause- and -effect relationship
원인이 되어 영향이 나타나는 것
★ Loss function 손실함수
A function that measures the distance between the observed values and the model's estimated value
데이터분석가는 손실함수를 최소로 하는 값을 구하고자 한다.
선형회귀에서도 마찬가지이다. 우리는 어떤 선을 찾아낼 것인데, 아무 선을 찾는 것이 아니라 손실함수를 최소로 하는 가장 적합한 선을 찾아내고 싶은 것이다.
<수학적인 이해>
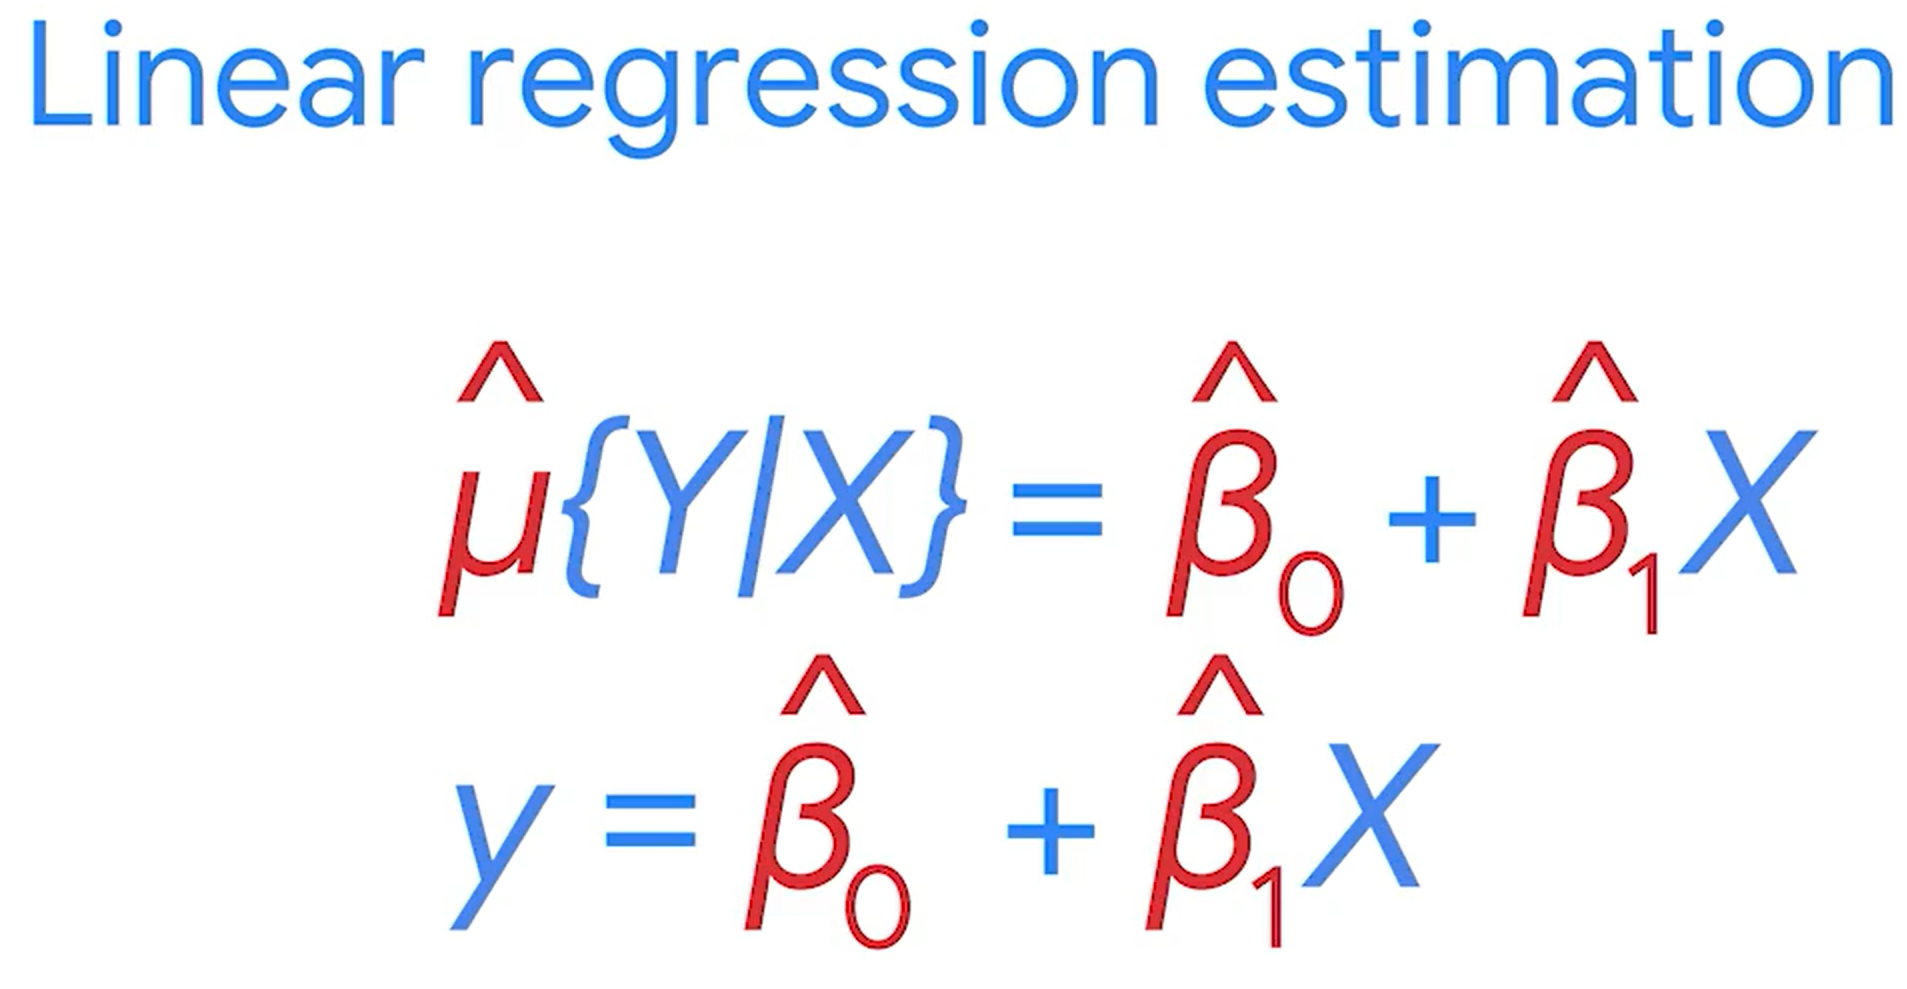
1) Observed values= actual values
모집단을 모두 알기란 현실성이 없다. 따라서 모집단을 대표하는 샘플들로 regression 모델을 만든다.
The existing sample of data
2) 선형 회귀의 목적
두 변수들 간에 어떤 관계가 있는지를 아는 것
3) parameter = Regression coefficients = slope, intercept
모집단을 다 확인할 수 없으니 샘플들로 parameter를 추정할 수 있지만, 이 값이 모집단의 파라미터와 같은지 100% 확실할 수 없다.
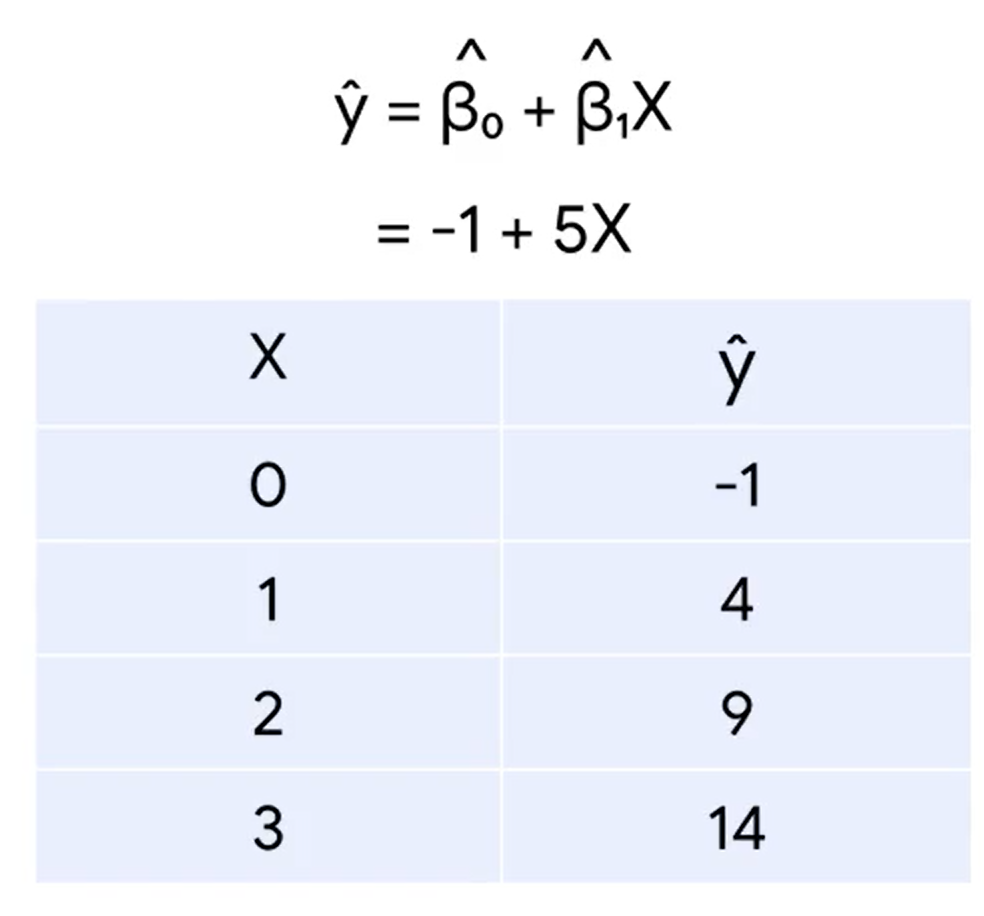
x가 1 증가함에 따라 y는 5만큼 증가한다.
4) Ordinary Least Squares Estimation(OLS)
선형회귀에서 결정계수를 계산하는 가장 보편적인 방법
Logistic regression
A technique that models a categorical dependent variable based on one or more independent variables.
discrete events 또는 categorical한 복잡한 확률 문제를 해결하기 위해 logistic regression 모델을 사용한다.
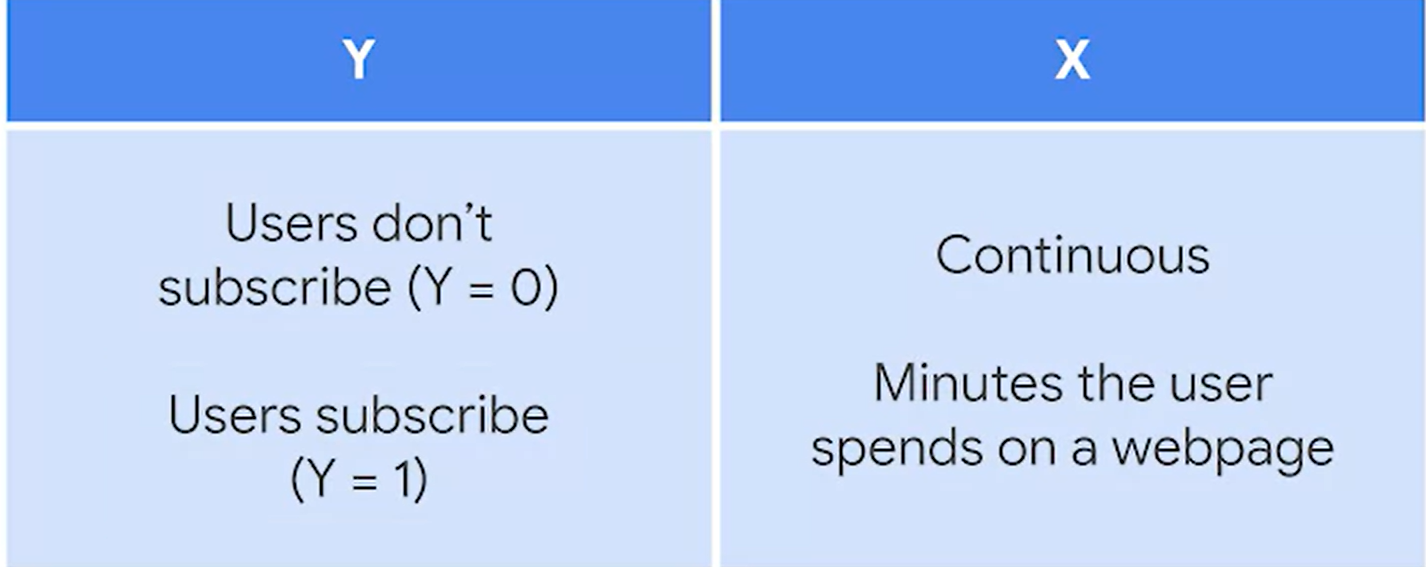
ex) 고객이 뉴스레터를 구독할 것인가, 구독하지 않을 것인가에 대한 확률을 구한다.----> Y
이를 결정하는 한 요소는 사용자가 해당 뉴스레터 페이지에 얼마나 오래 체류하는가이다. ----->X
샘플 데이터를 scatter plot으로 그려보자
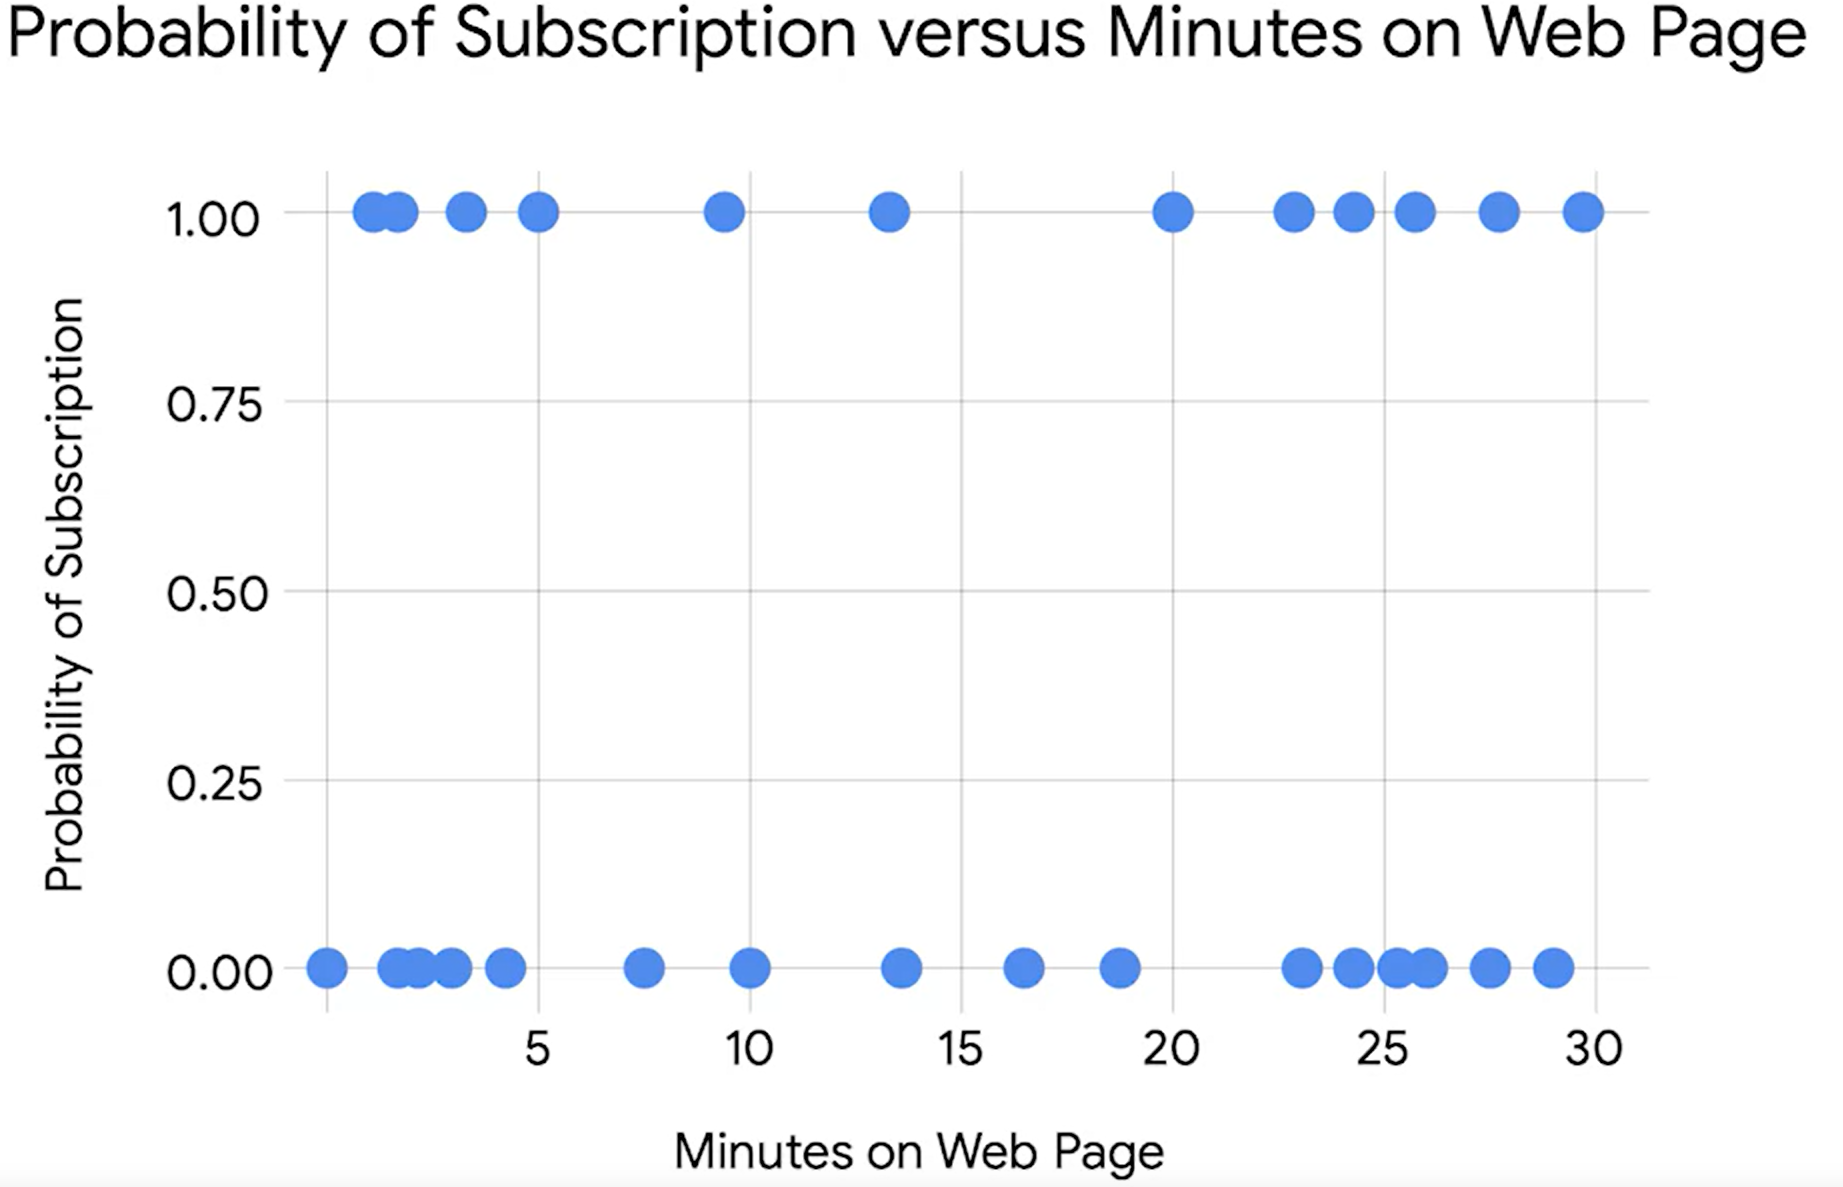
그래프를 그렸더니, 유의미한 insight가 나오고 있지 않다. 따라서 이를 해석할 수 있는 수학적인 다른 방법을 고안해야 한다. 그것이 바로 확률이다. X가 주어진 상황에서 Y=1인 경우의 확률을 구하는 것이 이 문제의 해결점이 되는 것이다.

★ Link function 연결함수
A nonlinear function that connects or links the dependent variable to the independent variables mathematically.
비선형 함수로 종속변수를 독립면수와 수학적으로 연결해준다.
linear regression vs logistic regression
| linear regression | logistic regression |
| continuous data | discrete data |
| estimating the mean of y | estimating the probability of an outcome |
y 값이 직접 구해진다. |
Y의 확률값은 link function으로 연결된다.  |