목차
★ Hyptothesis testing 가설검정
A statistical procedure that uses sample data to evaluate an assumption about a population parameter.
샘플링된 데이터를 이용하여 모집단에 대해 설정한 가정을 평가하는 통계적 과정이다.
모집단에 대해 어떤 가설을 설정한 뒤, 표본관찰을 통해 그 가설의 채택여부를 결정한다.
표본을 이용해 미지의 모집단 모수에 대한 두 가지 가설을 놓고 어느 가설을 선택할 것인지 '통계적'으로 의사결정한다.
<예시>
ex) 해당 약이 환자들을 감기에 낫게하는데 정말 도움이 되는가? 아니면 우연적으로 발생한 것인가?
병원에서는 감기에 걸린 환자를 대상으로 특정 약이 유효한가를 평가하기 위해 hypothesis testing을 한다.
ex) 동전게임을 할 것인데, 이 동전이 공정한가 아니면 조작인가에 대해 알고 싶다.
Fair coin이라면 한 번 던졌을 때 50%의 확률로 뒷면이 나온다.
Rigged coin이라면 90-100%의 높은 확률이 나올 것이다.
2번 던졌을 때: 0.5*0.5=0.25 = 25%
4번 던졌을 때: 0.5*0.5 *0.5*0.5=0.0625=6.25%
6번 던졌을 때: 0.5*0.5 *0.5*0.5 *0.5*0.5=0.0156%
그냥 막 2, 4,6번 던졌는데 기적적으로 계속 뒷면이 나올 수도 있지만 통계적으로 그것은 매우 희박한 확률이다.
그래서 통계적으로 의미를 풀어내기 위해 threshold를 지정한다.
예컨데 threshold를 5%로 지정하면, 6번 던졌을 때 5% 이하의 확률로 뒷면이 나온다면 이 동전은 fair coin이라고 말할 수 있다. 마찬가지로 5% 이상의 확률로 뒷면이 나온다면 이 동전은 조작된 것이라고 말할 수 있다.
< Procedure >
1. State the null hypothesis and the alternative hypothesis
1) ★ Null hypothesis 귀무가설
A statement that is assumed to be true unless there is convincing evidence to the contrary.
현재 상태가 참이다.
보편적으로 관찰하는 데이터가 우연적인 발생이라는 것을 가정한다.
모집단의 특성에 대해 옳다고 제안하는 주장이다. 과거의 경험, 지식, 연구 결과 등 현재까지 당연히 인정되어 온 것이다.
ex) Null: The coin is fair---> 보편적인 상태로, 온전히 우연으로 발생한다.
2) ★ Alternative hypothesis 대립가설
A statement that contradicts the null hypothesis, and is accepted as true only if there is convincing evidence for it.
null hypothesis와 반대되는 진술로, 강력한 증거가 있을 때 받아들여진다.
보편적으로 관찰하는 데이터가 우연적으로 발생하는게 아니라는 것을 가정한다.
귀무가설을 기각하면 채택되는 가설이다. 즉, 귀무가설이 틀렸다고 제안하는 가설이다.
대립가설은 연구자가 기존상태로부터 새로운 변화 또는 효과가 존재한다는 주장을 나타내므로, 연구자는 귀무가설을 부정하고 대립가설을 지지하고자 한다.
ex) Alternative: The coin is not fair--> 동전이 조작된 것이며 이것은 우연으로 발생한 것이 아니라는 가정이다.
2. Choose a significance level
★ Significance level 유의수준
The probability of rejecting the null hypothesis when it is true.
null hypothesis가 참이라는 것을 기각할 수 있는 확률이다.
Significance level is the threshold at which a result is considered statistically significant. It is also the probability of rejecting a null hypothesis when it is true.
5, 10, 1% 등 상황에 따라서 정할 수 있다.
ex) significance level = 5%
3. Find the p-value
★ P-value 유의확률
The probability of observing difference in your result as or more extreme than the difference observed when the null hypothesis is true.
null hypothesis가 참일 때 관찰되는 확률
귀무가설이 사실일 확률
귀무가설이 사실이라는 전제하에 검정통계량이 표본에서 계산된 값과 같거나 그 값보다 대립가설 방향으로 더 극단적인 값을 가질 확률
관측된 표본통계량에 입각하여 귀무가설을 기각할 수 있는 유의수준의 최소치 --> 관측된 유의수준이라고도 함
ex) 6번 던졌을 때 모두 뒷면이 나올 확률은 1.56%이다. 즉, p-value는 1.56%가 되는 것이다.
4. Decide: Reject or fail to reject the null hypothesis
hypothesis test는 100% 확실한 것이 아니라, 확률에 가정하고 있다.
p값이 작을수록 귀무가설을 기각할 충분한 근거를 갖게 되고, 반대로 p값이 크면 귀무가설을 채택할 가능성이 높다.
★ 1) p-value < significance level : reject the null hypothesis
★ 2) p-value > significance level : fail to reject the null hypothesis
★ Statistical significance
The claim that the results of a test or experiment are not explainable by chance alone.
시험의 결과가 우연적으로 발생한 것이 아니고 통계적으로 유의미하다는 것을 주장하는 것
ex) 해당 약은 환자들을 감기에서 낫게하는데 도움이 된다면 statistical significance하다.
ex) significance level: 5%
p-value:1.56%
1.56% < 5%
conclusion: Reject the null hypothesis
----> 6번을 연속으로 던진 결과는 statistically significant and not due to chance!
ex) significance level: 1%
p-value:1.56%
1.56% > 1%
conclusion: Fail to Reject the null hypothesis
----->6번을 연속으로 던진 결과는우연으로 발생한 결과이며 null hypothesis를 기각하지 못한다.
Types of errors
statistically significant는 100% 정확도를 바랄 수 없다. 왜냐하면 hypothesis test가 확률에 기반하기 때문이다.
따라서 상황에 따라 오류가 발생하는데, hypothesis testing에는 대표적으로 2가지 에러가 있다.
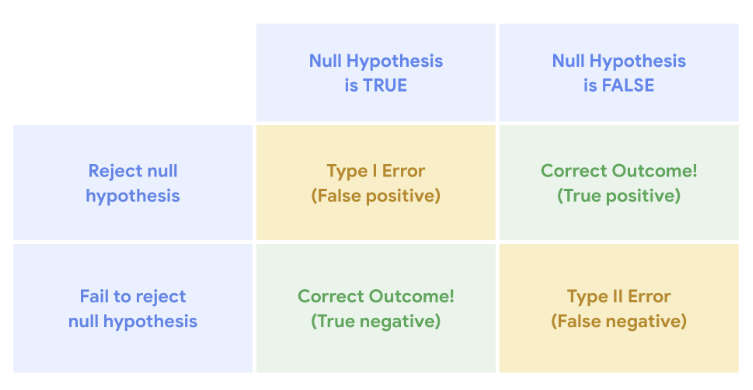
1) Type 1 error : ★ 1종오류
False Positive
귀무가설이 맞는데, 틀렸다고 한 경우
The rejection of a null hypothesis that is actually true.
ex) 결론: 동전은 조작되었다. 사실: 동전은 공정하다
-----> null hypothesis가 맞았고, 조작된 것이 아니라 우연으로 발생한 것이였다.
만약 1종 오류를 줄이고 싶다면 significance level을 낮추면 된다.
왜냐하면 p-value가 ssignificance level보다 크면 귀무가설이 채택되기 때문이다.
하지만 이런 경우 type 2 error가 커진다.
2) Type 2 error : ★ 2종 오류
False Negative
귀무가설이 틀렸는데, 맞았다고 한 경우
The failure to reject a null hypothesis which is actually false
ex) 결론: coin 은 공정하다 ---> 사실: 조작되었다.
3) Power of test ★ 검정력
1- type2 error
거짓인 귀무가설을 기각하는 확률이다.
Test type
1) One-sample hypothesis test
Determines whether or not a population parameter like a mean or proportion is equal to a specific value.
ex) 2023년 평균 온라인 판매량이 목표했던 값과 같은지
★ z-test
one-sample z-test assumptions 가정
- The data is random sample of a normally distributed population
데이터는 정규분포를 이루는 무작위 샘플들로 이루어져있다.
- The population standard deviation is known.
모집단의 표준편차는 이미 알려져있다.
- z-test의 검정통계량은 Z-score이다.
- z-score은 Z 분포 즉 정규분포를 베이스로 한다.
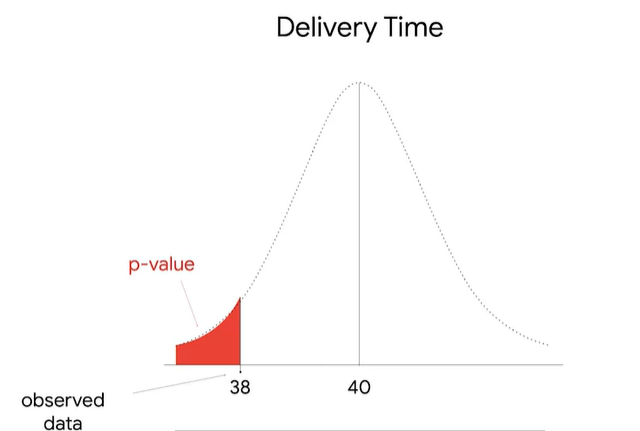
ex) online delivery data
<population>
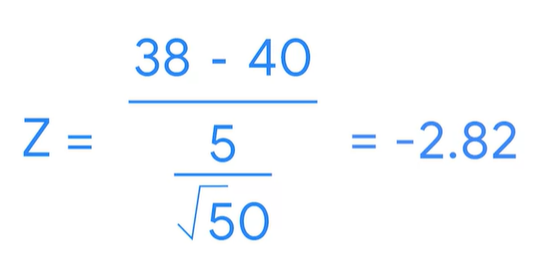
mean=40 min
standard deviation=5
<sample>
mean=38 min
standard deviation=5
--->질문: 평균이 2 min 만큼 떨어졌는데 이건 우연적인 것이냐 아니면 통계적으로 유의미한 것이냐?
<Procedure>
1. State the null hypothesis and alternative hypothesis
귀무가설: 평균이 떨어진 것은 우연이다. 즉, 평균은 40min이다. mean= 40
대립가설: 평균이 떨어진 것은 유의미한 일이다. 즉 평균은 40 min가 아니며, 평균은 40min보다 더 낮을 것이다. mean < 40
----> one-tailed tests
2. Choose a significance level
유의수준(우리의 결과가 통계적으로 유의하다는 것을 보여주는)을 고른다.
이것은 귀무가설을 기각하는 확률이기도 하다.
여기서는 5%로 잡는다.
이를 위해서 아래의 p-value를 구하자.
3. Find the p-value
보통은 p-value를 컴퓨터로 구하지만, p-value에 대해 더 깊게 이해하기 위해 p-value가 어떻게 구해지는지 그 과정을 살펴보도록 하자.
★ Test statistc 검정통계량
A value that shows how closely your observed data matches the distribution expected under the null hypothesis.
귀무가설 아래에서 관찰된 표본들의 데이터가 얼마나 모집단의 분포와 일치하는가를 나타내는 값이다.
귀무가설의 진위여부를 규명하기 위해 가설검정과 관련된 모집단으로부터 표본을 무작위로 추출하여 필요한 계산을 하는 표본 통계량
위 모집단의 분포가 정규분포이기 때문에, z-test를 수행한다. 이를 위해 z-score을 이용한다.
z-score은 표준편차가 평균으로부터 얼마나 떨어져있는지를 측정한 값이기 때문에, 내가 측정한 데이터가 평균으로부터 얼마나 떨어져있는지를 표시해준다.
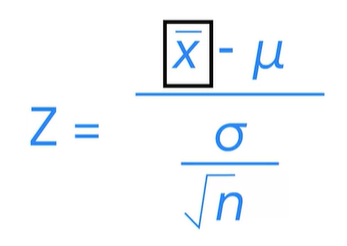
x바= 표본평균
M뮤= 모집단 평균
시그마= 모집단 표준편차
n= 샘플 개수
Left-tailed test, Right-tailed test
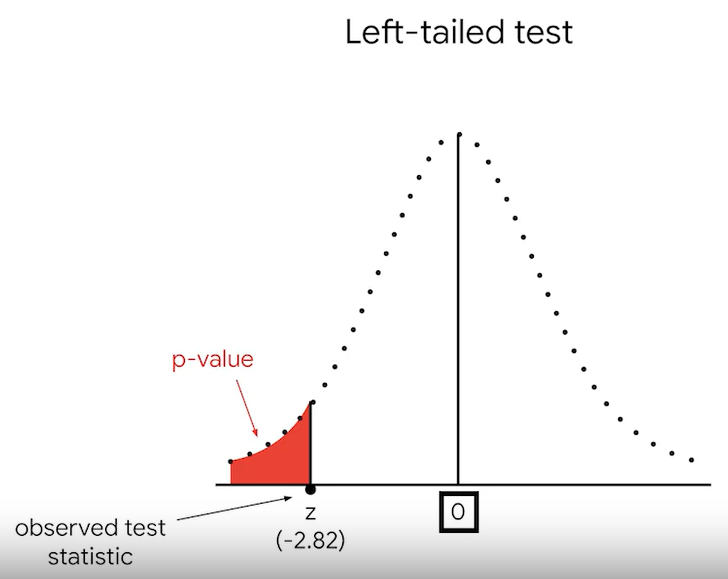
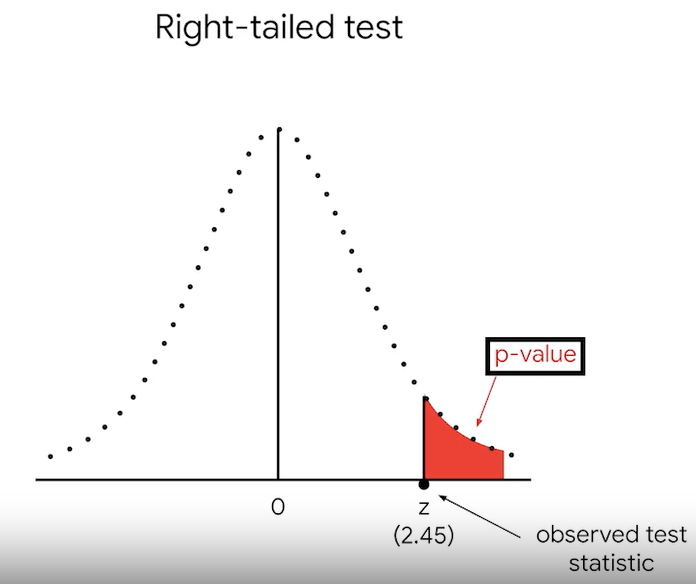
p-value= 0.0023 or 23%
4. reject or fail to reject the null hypothesis
p-value:0.23% < significance level:5%
통계적으로 유의하다. 따라서 귀무가설을 기각한다.
2) Two-sample hypothesis test: Mean
Determines whether or not a population parameter like two mean or proportion are equal to each other.
---> AB테스트, t테스트를 주로 한다.
Two-sample t-test for means assumptions 가정
- The two samples are independent of each other
두 샘플은 서로 독립적이다.
- For each sample, the data is drawn randomly from a normally distributed population
각각의 샘플은 무작위적이며 모집단은 정규분포를 따른다.
- The population standard deviation is unknown
모집단의 표준편차는 알지 못한다.
보통 데이터가 너무 크면, 모집단의 표준편차를 알기 쉽지 않다.
★ T-test
그래서 실질적으로 t-test가 많이 쓰인다.
- t-test의 검정통계량은 T-score이다.
- T-score은 T 분포를 베이스로 한다.
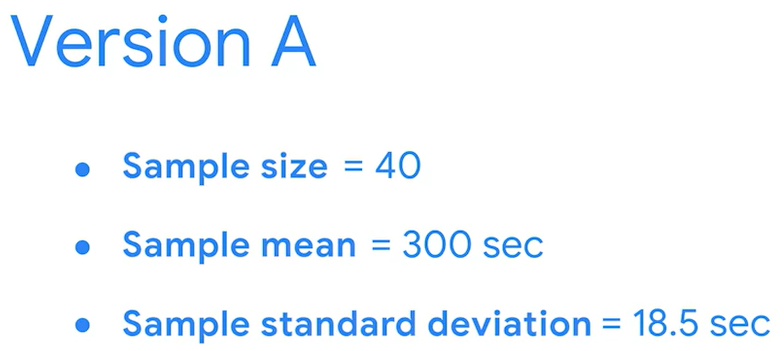
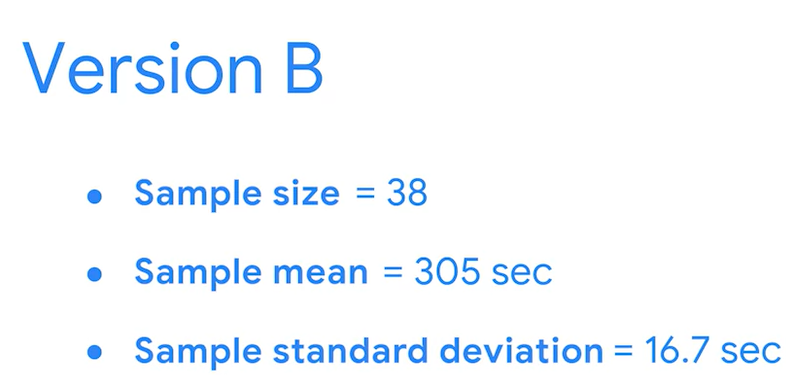
ex) 쇼핑몰의 배경화면 하나는 그레이, 하나는 초록이
1. State the null hypothesis and alternative hypothesis
귀무가설: 화면을 바꿔도 체류시간은 300sec로 변함이 없다. mean=300sec
대립가설: 화면을 바꾸면 체류시간300이 아닐 것이다. mean !=300sec
----> Two-tailed tests
2. Choose a significance level
결과가 통계적으로 유의미하다고 생각할 수 있는 기준인 유의수준을 정한다.
significance level = 5%
3. find the p-value
p-value <5% 면 귀무가설을 기각하고 대립가설을 채택한다.
보통 p-value를 구하기 위해서 파이썬 패키지를 이용하면 되지만, 포뮬라를 이해하고 직접 계산해보자..
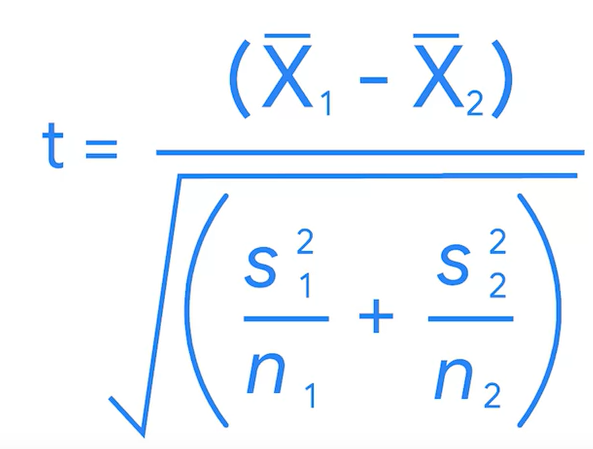
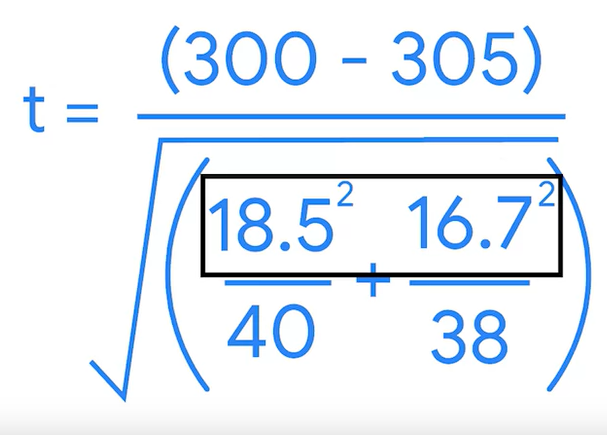
t= -1.2508
alternative hypothesis states that there is a difference in the mean time spen on version A and version B.
The observed difference is 5 seconds.
if you find a statistically significant difference between the means, either less than or greater than the observed difference of 5 seconds, you will reject the null hypothesis.
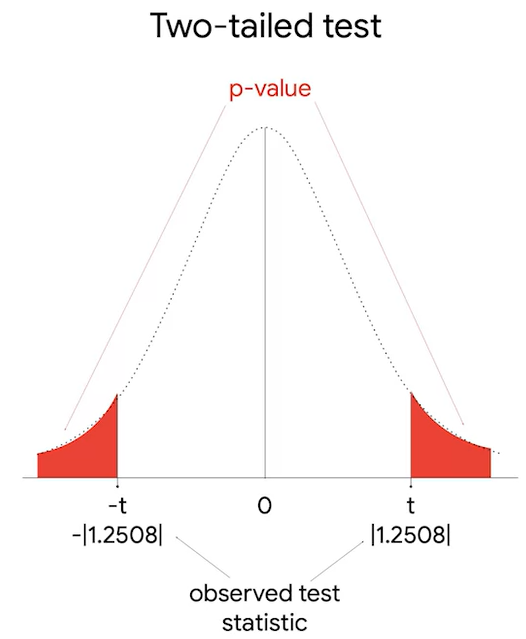
p-value=21.48%=0.2148
4. reject or fail to reject the null hypothesis
21.48> 5%
따라서 귀무가설을 채택한다.
이 말은 관찰된 차이는 우연적인 결과에 불과하다.
3) Two-sample hypothesis test: proportion
★ z-test
(t-test로는 two-sample test proportion 안됨)
ex) 베이징지사와 런던지사 중 선호하는 지사의 비율
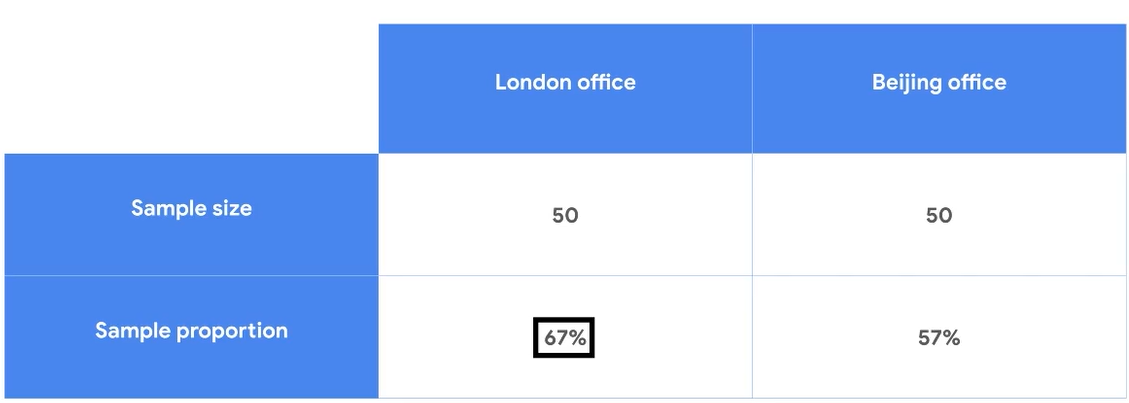
1. State the null hypothesis and alternative hypothesis
귀무가설: 런던, 베이징 선호도는 같다.
대립가설: .런던, 베이징의 선호도가 다를 것이다.
----> Two-tailed tests
2. Choose a significance level
결과가 통계적으로 유의미하다고 생각할 수 있는 기준인 유의수준을 정한다.
significance level = 5%
3. find the p-value
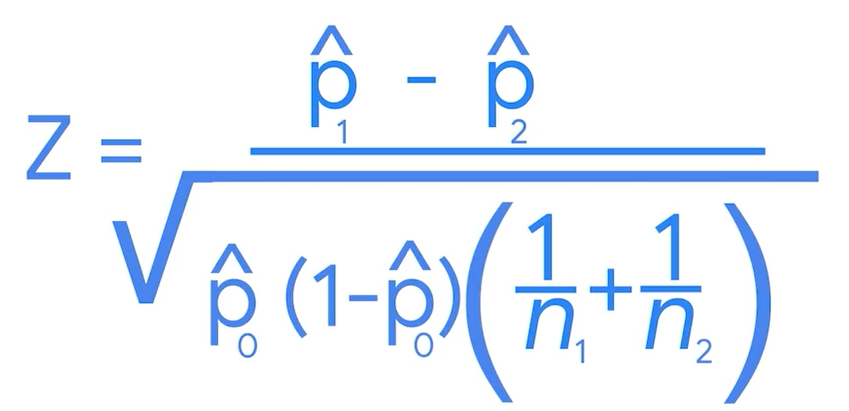
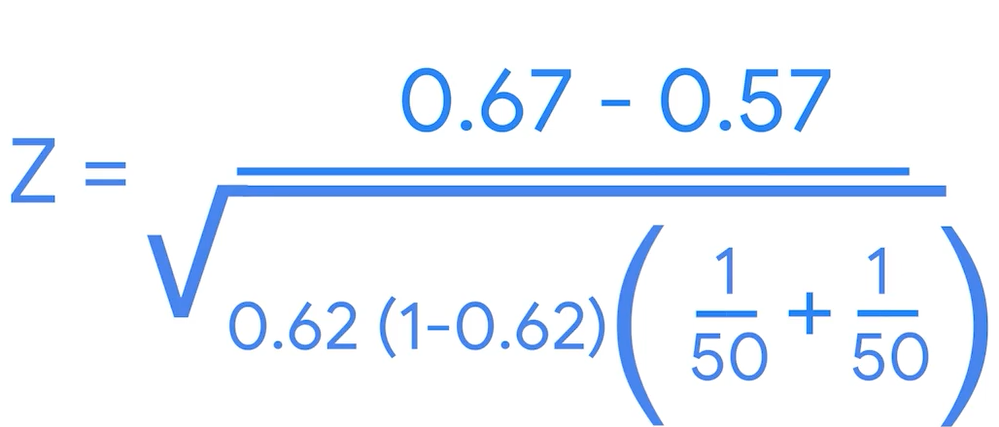
p0_hat is pooled proportion that is weighted average of the proportion of two sample datas( 두 개 비율의 평균)
z-score= 1.03
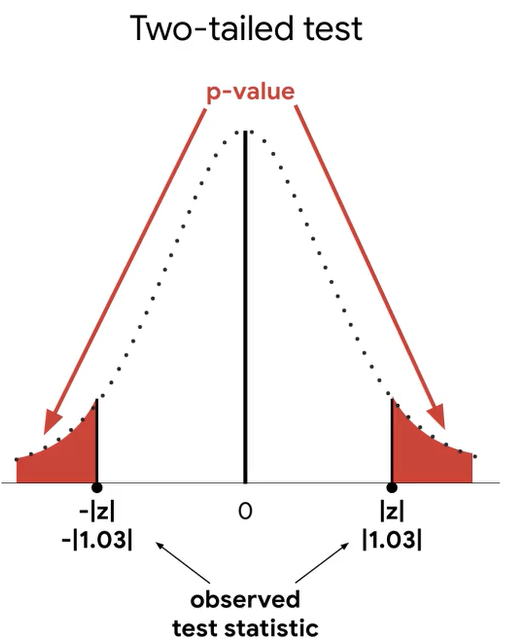
p-value=30.3%
4. reject or fail to reject the null hypothesis
30.3%>5%
귀무가설을 기각한다.