목차
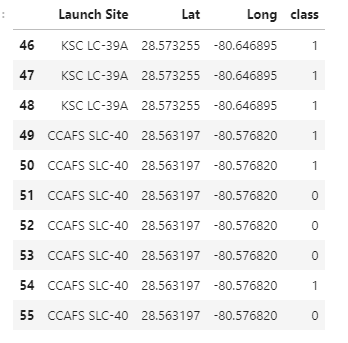
1. 기본 dataframe : launch_sites_df

2. Map 만들기
nasa_map= folium.Map(location=[28.56230197, -80.57735648], zoom_start=10)
nasa_map
3. featuregroup 클래스로 객체 생성하기
지도에 놓이는 객체들을 쉽게 관리하고, 코드의 가독성을 높이기 위함
which = folium.map.FeatureGroup()
4. 지도에 특정 위치 circle로 표기
circle 객체는 which에 담고, which를 맵에 추가한다.
for lat, lng in zip(launch_sites_df['Lat'], launch_sites_df['Long']):
    # 지도 위치 표시하기
    which.add_child(
        folium.features.CircleMarker(
            [lat, lng],
            radius=5,
            color='red',
            fill=True,
            fill_color='blue',
            fill_opacity=0.4
        )
    )
nasa_map.add_child(which)
5. 마우스로 위치 클릭하면 팝업 메시지 나오도록 설정
for lat, lng, label in zip(launch_sites_df['Lat'], launch_sites_df['Long'], launch_sites_df['Launch Site'] ):
    # 지도 마커 표시하기(누르면 라벨이 보여요)
    which.add_child(
        folium.features.CircleMarker(
            [lat, lng],
            radius=7,
            color='red',
            fill=True,
            fill_color='blue',
            fill_opacity=0.4,
            popup=label,
        )
    )
nasa_map.add_child(which)
6. Divicon으로 화면에 표시되는 라벨 만들기
DivIcon을 사용했다. html 태그가 들어간다.
for lat, lng, label in zip(launch_sites_df['Lat'], launch_sites_df['Long'], launch_sites_df['Launch Site'] ):
    # 지도 마커 표시하기(누르면 라벨이 보여요)
    which.add_child(
        folium.map.Marker(
        [lat, lng],
        # Create an icon as a text label
        icon=DivIcon(
            icon_size=(20,20),
            icon_anchor=(0,0),
            html='<div style="font-size: 10; color:blue;"><b>%s</b></div>' % label,
            )
        )
    )
nasa_map.add_child(which)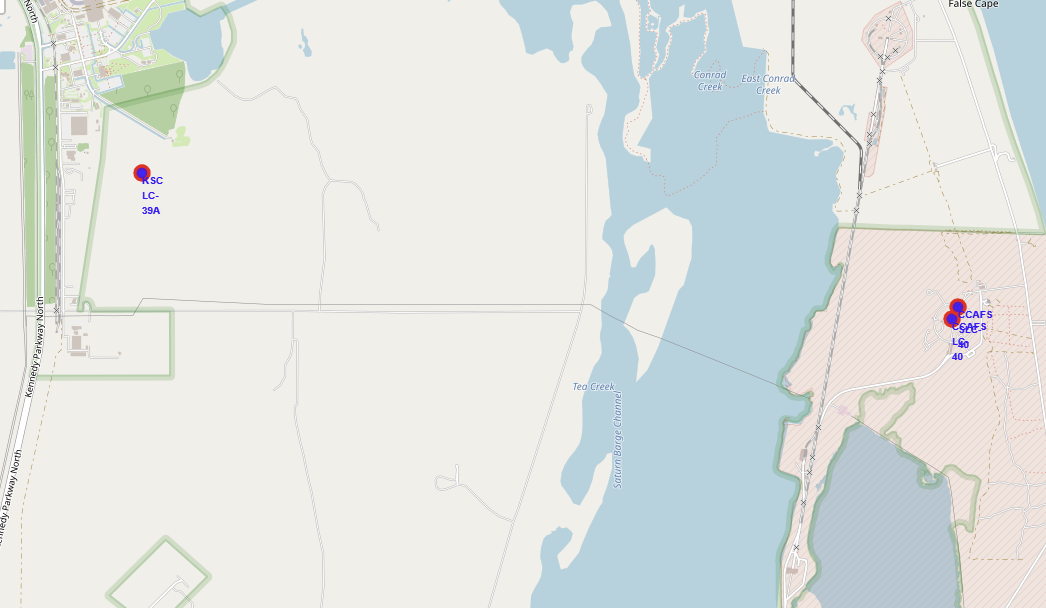
이번에는 새로운 데이터 프레임을 가지고 새로운 정보를 지도에 넣어보자.
dataframe: spacex_df
marker_color라는 새로운 컬럼을 추가한다.
class가 1이면 green, class가 0이면 red를 추가한다.
for index, record in spacex_df.iterrows():
    if record['class']==1:
        spacex_df.loc[index, 'marker_color']='green'
    else:
        spacex_df.loc[index, 'marker_color']='red'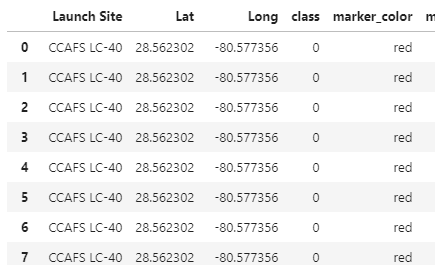
7. MarkerCluster 클래스 객체 생성
Markercluster은 folium 패키지 기능 중 하나로, 지도 위에 데이터 포인트를 클러스터링하여 표시한다.
데이터 포인트가 많은 경우 유용하게 사용한다.
수 많은 마커를 하나의 cluster(군집)으로 묶어 쓸 수 있기 때문에
지도를 보다 깔끔하게 유지하며, 데이터의 분포를 공간에 시각화하는 데 좋다.
from folium.plugins import MarkerCluster
marker_cluster = MarkerCluster()
nasa_map.add_child(marker_cluster)
8. marker 객체 안에 icon 객체 넣기
for index, record in spacex_df.iterrows():
    # TODO: Create and add a Marker cluster to the site map
    marker = folium.Marker(
        [record['Lat'], record['Long']], #location
        icon=folium.Icon(
            color='white',
            icon_color=record['marker_color']
        )
    )
    marker_cluster.add_child(marker)

nasa_map.add_child(marker_cluster)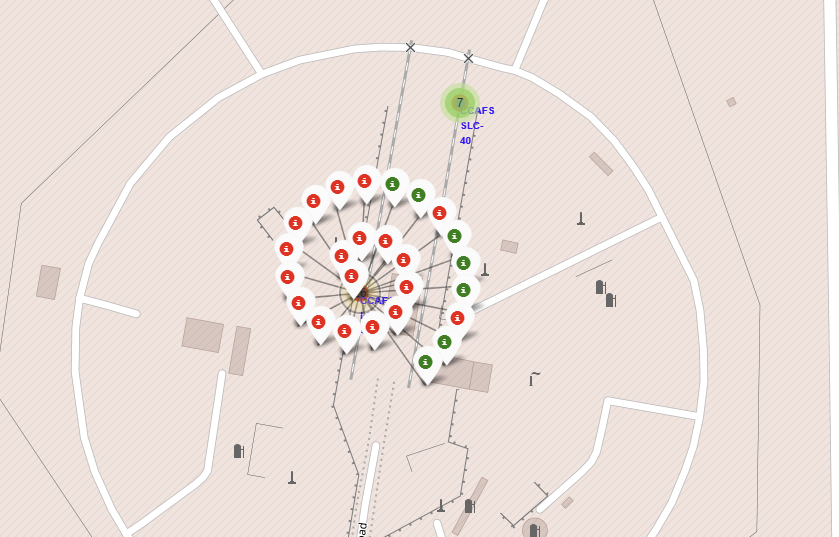
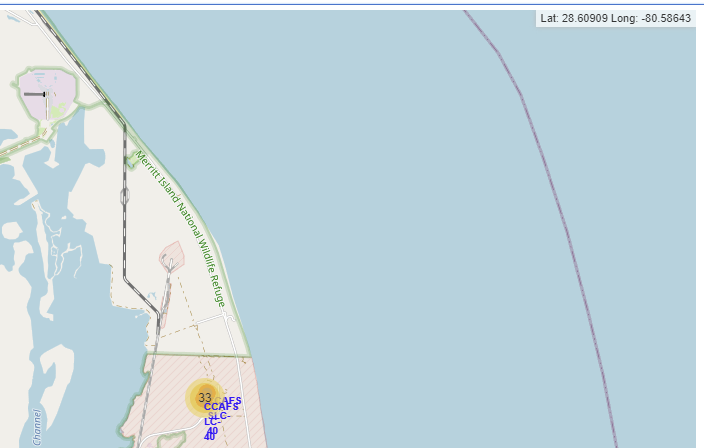
9. MousePosition 마우스포지션
이번에는 내가 마우스를 움직임에 따라서 지도의 한쪽에 lat, long이 표시되도록 맵을 만들어보자.
mouseposition 기능으로 사용자는 지도 위의 특정 위치의 위도와 경도 값을 쉽게 확인할 수 있다.
from folium.plugins import MousePosition
formatter = "function(num) {return L.Util.formatNum(num, 5);};"
mouse_position = MousePosition(
    position='topright',
    separator=' Long: ',
    empty_string='NaN',
    lng_first=False,
    num_digits=20,
    prefix='Lat:',
    lat_formatter=formatter,
    lng_formatter=formatter,
)
nasa_map.add_child(mouse_position)
formatter 변수 설정: 좌표 정보를 포맷팅하는 데 사용될 JavaScript 함수의 포맷터를 정의합니다. L.Util.formatNum 함수를 사용하여 소수점 이하 5자리까지 표시하도록 설정합니다.
MousePosition 객체 생성: 설정 옵션을 지정하여 MousePosition 객체를 생성합니다. position 매개변수를 사용하여 좌표 정보의 위치를 지정하고, separator를 사용하여 위도와 경도 사이의 구분자를 설정합니다. empty_string을 사용하여 좌표 정보가 없을 때 표시될 문자열을 설정합니다. lng_first는 False로 설정하여 위도(Latitude)를 먼저 표시하도록 설정합니다. num_digits를 사용하여 소수점 이하 자릿수를 지정하고, prefix를 사용하여 좌표 정보 앞에 추가할 접두사를 설정합니다. 마지막으로 lat_formatter와 lng_formatter를 사용하여 좌표 포맷터 함수를 설정합니다.
MousePosition 추가: add_child() 메서드를 사용하여 MousePosition을 Folium 지도에 추가합니다. 이렇게 하면 지도 위에 마우스 커서 위치에 대한 좌표 정보가 표시됩니다.
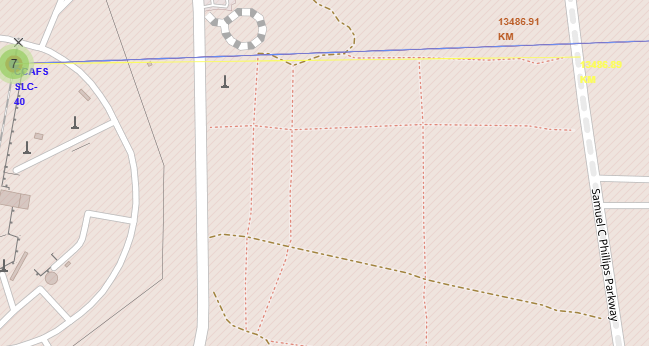
10. 두 점 간의 거리 구하기
지구에서 두 위치의 좌표를 알고 있을 때, 두 위치 사이의 거리를 구하는 함수이다.
from math import sin, cos, sqrt, atan2, radians

def calculate_distance(lat1, lon1, lat2, lon2):
    # approximate radius of earth in km, 지구의 근사 반지름
    R = 6373.0

    lat1 = radians(lat1) #라디안으로 변환
    lon1 = radians(lon1)
    lat2 = radians(lat2)
    lon2 = radians(lon2)

    dlon = lon2 - lon1
    dlat = lat2 - lat1

    a = sin(dlat / 2)**2 + cos(lat1) * cos(lat2) * sin(dlon / 2)**2
    c = 2 * atan2(sqrt(a), sqrt(1 - a))

    distance = R * c
    return distance
임의로 coastline의 lat, lng를 넣었다.
coast_lat=28.56348
coast_lng=-80.56794
launch_site_lat=28.563197
launch_site_lng=-80.576820
distance= calculate_distance(launch_site_lat, coast_lat, launch_site_lng, coast_lng)
folium의 marker를 이용해 icon을 표시한다.
distance_marker = folium.Marker(
   [coast_lat, coast_lng],
   icon=DivIcon(
       icon_size=(20,20),
       icon_anchor=(0,0),
       html='<div style="font-size: 12; color:#d35400;"><b>%s</b></div>' % "{:10.2f} KM".format(distance),
       )
   )
nasa_map.add_child(distance_marker)
11. polyline 지도에 선 긋기
두 점 간에 선을 긋는다.
lines=folium.PolyLine(locations=[[launch_site_lat, launch_site_lng], [coast_lat,coast_lng]], weight=1)
nasa_map.add_child(lines)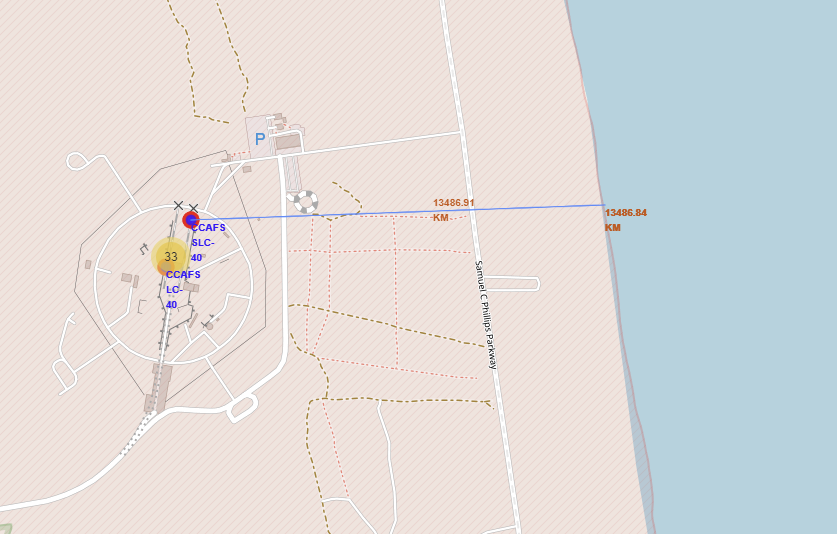
도로에서 launch_site까지의 거리를 구해본다.
raild_lat=28.56327
raild_lng=-80.57075
distance= calculate_distance(launch_site_lat, raild_lat, launch_site_lng, raild_lng)
lines=folium.PolyLine(locations=[[launch_site_lat, launch_site_lng], [raild_lat,raild_lng]], weight=1, color="yellow")
nasa_map.add_child(lines)