목차
Statistics
The study of the collection, analysis, and interpretation of data.
데이터를 수집, 분석, 해석하는 학문이다.
1. 데이터분석에서 통계학의 근본적인 역할
1) ★ 통계의 활용분야
최근 빅데이터의 생산으로 데이터분석가의 역할이 점점 중요해지고 있다. 데이터분석에서 통계가 차지하는 비중도 크기 때문에 통계를 공부해야 할 필요가 있다. 데이터분석가는 아래의 분야에서 통계를 데이터 분석에 활용한다.
- Business, Medicine, Science, Engineering, Governmet
2) ★ 데이터분석에 활용되는 통계 방법
- identify meaningful patterns and relationships in data
- Analyze and quatify uncertainty
- Generate insights from data
- Make informed predictions about the future
- solve complex problems
2. 통계의 개념
- probability
- Average
- Margin of Error
- Percentile
- Median
3. 통계용어
★ Population 전체
Every possible element that you are interested in measuring
statical population의 예시: people, objects, events
★ Sample 전체의 부분
A subset of population
★ Representative sample 대표성을 띄는 샘플
A sample that accurately reflects the polulation
★ Parameter
A characteristic of a polulation
전체에 대한 특징이다.
★ Statistic
A characteristic of a sample
부분에 대한 특징이다.
★ Confidence interval 신뢰구간
A range of values that describes the uncertainty surrounding an estimate
★ Statistical significance 유의성
The claim that the results of a test or experiment are not explainable by chance alone
3. A/B test
A way to compare two versions of something to find out which version performs better.
두 개의 버전을 만들고 나서, 어떤 것이 더 성과가 좋은지 비교하는 실험이다.
★ 사용예시: Marketing emails, Online ads
★ 단계
1) Analyzes a small group of users(sampling)
2) Decide on the sample size
3) Determine the statistical significance
4. ★ Descriptive Statistics(Mean, Median, Mode, range, std, variance, percentile, quantile, IQR, five number summary)
Describe or summarize the main features of a dataset.
데이터셋을 요약하거나 묘사하는 형태의 통계이다.
1) Format 형태
Descriptive할 수 있는 형태는 두 가지이다.
- Visuals(graghs and tables)
- Summary stats(single number like average)
2) Types of descriptive statistics ------> Summary stats
1) ★ Measures of central tendency
Describe the center of data
많은 양의 데이터에서 '중간'의 값을 파악하고 나면, 전체적인 데이터셋의 구조를 이해하기 용이해진다.
★ Mean 평균값
★ Median 중앙값
만약 outlier가 존재한다면, Median이 더욱 유의미한 값이 되고
outlier가 없다면, Mean이 유의미한 값이 된다.
★ Mode 최빈값
The most frequently occuring value in a dataset
1,2,3,4,5 no mode
1,2,2,3,4 one mode
1,2,2,3,3 two mode
2) Measures of dispersion
Describe the spread of dataset, or the amount of variation in data points(Standard Deviation)
얼마나 분포되어 있는지 그 정도를 본다.
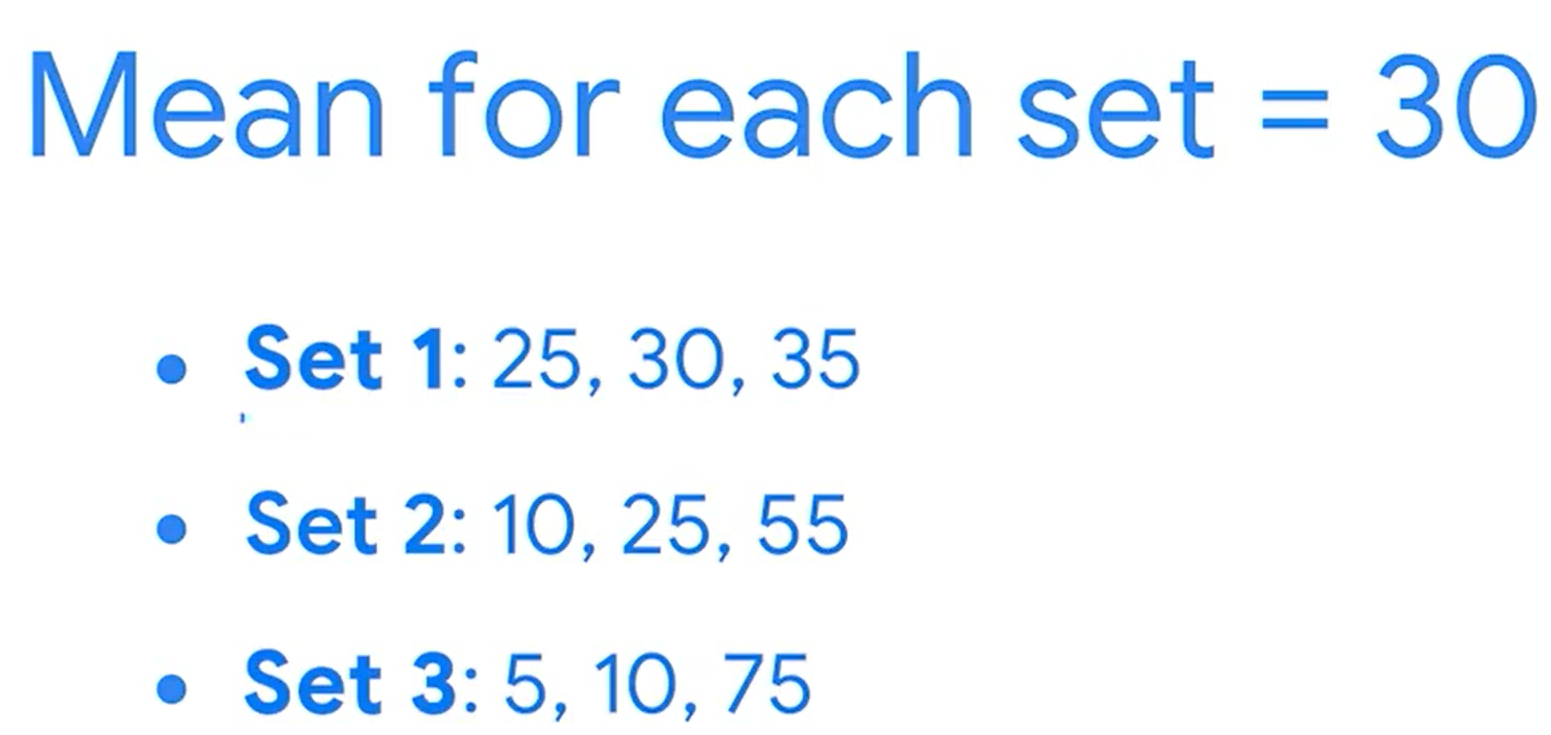
아래의 예시를 보자. 세 가지 set 모두 mean은 30이지만, 분포도는 다르다.
따라서 분포를 측정해야 데이터를 정확하게 이해할 수 있다.

★ Range 범위
The difference between the largest and smallest value in a dataset
ex) 1,3,5,7,4,9 의 range는 largest 9- smallest 1= 8이다.
★ Standard deviation 표준편차
Measures how spread out your values are from the mean of your dataset
평균으로부터 데이터가 얼마나 떨어져있는지를 구한다.
데이터전문가들은 표준편차를 ad revenues, stock prices, employee salaries 등에서 사용한다.

★ Variance 분산
The average of the squared difference of each data point from the mean
3) Measures of position
Determine the position of a value in relation to other values in a dataset.
우리 실생활의 경우 위치를 측정한다는 것은 아래와 같은 상황이 있다.
미술관이 공원과 얼마나 떨어져 있는가?
좋아하는 식당이 회사와 얼마나 가까이 있는가?
통계학에서 위치를 측정하는 방법은 아래와 같다.
★ Percentiles
The value below which a percentage of data falls
★ Quartiles
Divides the values in a dataset into four equal parts
전체를 4개로 나눈다.

★ Interquartile range (IQR)
Q3-Q1= 75percentile- 24percentile
★ Five number summary
전체적인 데이터 분포를 알 수 있게 한다.
The Minimum
Q1
Q2= Median
Q3
The Maximum
★ Box plot

5. Inferential Statistics
- Make inferences about a dataset based on a sample of the data
데이터를 가지고 결론을 내야 하는 경우에 한다.
- Sampling
- Confidence intervals
- Hypothesis testing
6. Python
아래의 자료를 가지고, 파이썬에서 통계적인 내용을 살펴보자.


1) describe()


- unique: 고유한 값의 개수
- top= mode 가장 출현 빈도가 높은 값
- freq top의 출현빈도
2) mean(), median()
이 두 함수로 outlier가 있는지 없는지를 확인할 수 있다.
3) std()
표준편차를 구한다.
4) min(), max()
최대값, 최소값을 구한다.