목차
Probability 확률
1) 개념
The branch of mathematics that deals with measuring and quantifying uncertainty.
The likelihood of sth happening.
ex) 로또에 맞을 확률, 내일 비가 올 확률
- 확률은 0~1 사이
- ★ 랜덤 실험
랜덤사건에서 우연한 값이 측정됨(=Random experiment)
A process whose outcome cannot be predicted with certainty
2) 데이터분석에서의 확률
확실하지 않는 상황에서 데이터에 기반한 결정을 내리기 위해 확률을 사용한다.
Types of Probability
1. objective
Based on statistics, experiments, and mathematical measurements
통계, 실험, 수학적인 측정에 근거한 확률이다. 데이터분석가 역시 objective probability에 근거하여 데이터분석을 한다.
1) Classical
Based on formal reasoning about events with equally likely outcomes
발생할 확률이 모두 같은 경우이다.
예) 동전을 던질 때, 앞이 나올 확률과 뒤가 나올 확률은 50%로 같다.
2) Empirical
Based on experimental and historical data
대다수의 사건은 classical하지 않고, 더욱 복잡한 경우이다.
이를 위해 Empirical Probability를 사용한다.
과거의 경험적인 실험이나 사건을 기반으로 한 확률이다.
ex) 기상예보를 통해 내일 비가올 확률을 정할 때
2. subjective
Based on personal feelings, experience, or judgment
통계나, 과학적인 사실에 근거한 것이 아니라 사람들의 기분이나 감정으로 결정된 확률이다.
ex) 경마 게임에서 이길 것 같은 경주말을 선택하는 것
Probability notation
P(A) = probability of event A
P(B) = probability of event B
P(A') = probabibility of not event A
Mutually exclusive events
Two events are mutually exclusive if they cannot occur at the same time
★ 상호배타적인 확률
두 개의 사건이 동시에 일어날 수 없는 경우를 말한다.
ex) 미국과 중국 여행을 동시에 할 수 없다. 오른쪽과 왼쪽을 동시에 갈 수 없다.
Independent events
Two events are independent if the occurrence of one event does not change the probability of the other event.
★ 독립사건
하나의 사건이 일어나는 것이 다른 사건에 영향을 주지 않은 경우이다.
ex) 오늘 아침 사과주스를 먹는 것이 메일이 전송되는 사건에 영향을 미치지 않는다.
Dependent events
Two events are dependent if the occurrence of one event changes the probability of the other event.
하나의 사건의 발생이 다른 하나의 사건에 영향을 미칠 때를 말한다.
ex) 여권을 가지고 있는지의 여부가 출입국심사에 영향을 미친다.
카드 뽑기를 했을 때 처음으로 Ace를 뽑을 확률 4/52에서, 두 번째로 Ace를 뽑을 확률은 3/51로 줄어든다.
Basic rules of probability
Mutually exclusive events-------->
1) complement rule
The event not occuring
P(A') = 1-P(A)
P(비가 오지 않을) = 1- P(비가 오는)
ex) 로또를 맞지 않을 확률, 비가 오지 않을 확률
Mutually exclusive events-------->
2) addition rule
sums up the probabilities of events.
각 사건의 발생 확률을 더할 때 사용하는 법칙이다.
P(A or B) = P(A) + P(B)
ex) P(주사위가 2 또는 4가 나오는 경우) = P(주사위 2) + P(주사위 4) = 1/6 +1/6= 2/6 =33%
Independent events-------->
3) multiplication rule
각 사건의 발생 활률을 곱할 때 사용하는 법칙이다.
P(A and B) = P(A) *P(B)
ex) P(첫 회에는 동전 앞면이, 다음 회에는 동전 뒷면이 나오는 경우) = P(첫 회에 동전 앞면 ) * P(다음 회에 동전 뒷면)
= 1/2 *1/2 =1/4 = 25%
Dependent events-------->
Conditional probability
★ 조건부 확률
The probability of an event occurring given that another event has alreay occurred.
P(A and B) = P(A) * P(B|A)
P(B|A) = probability of event B given event A
A가 발생한 상황에서 B가 발생할 확률
ex) P(A)= ace on first draw = 4/52
P(B|A) = ace on second draw = 3/51
P(A and B)= ace on first draw and second draw = 4/52 * 3/51 = 1/221 =0.5%
Prior Probability
The probability of an event before new data is collected
Posterior Probability
The updated probaility of an event based on new event
Occuring after
Bayes' Theorem
★ 베이즈 이론
1) 기본
Bayesian statistics 또는 Bayesian inference라고도 불린다.
데이터를 해석하고 분석하는데 많이 쓰이는 이론이다.
A powerful method for analyzing and interpreting data in modern data analytics


P(A) = Prior probability
P(A|B) = Posterior probability
ex) 알고 싶은 것: 아침에 흐렸을 때, 오후에 비가 올 확률
P(비가온다|흐리다) = P(흐리다|비가온다) * P(비가온다)/P(흐리다)
2) 확장
B의 확률을 모르는 경우 사용한다.

Random variable
★ 랜덤변수
Represents the values for the possible outcomes of a random event
1) Discrete
Has a countable number of possible values
Count the number of outcomes
셀 수 있는 수이다.
ex) 주사위의 수
2) Continuous
Takes all the possible values in some range of numbers
Measure the outcome
어떤 범위에 있는 수로서, 셀 수 없다.
ex) 키, 몸무게, 시간, 온도

Sample space
The set of all possible values for a random variable
★ 일어날 수 있는 모든 경우
ex) 동전 던지기 = {앞면, 뒷면}
Random experiment
A process whose outcome cannot be predicted with certainty
★ 랜덤실험
Probability distribution
Describes the likelihood of the possible outcomes of a random event
우연한 사건이 일어난 가능성을 말한다.
ex) 주사위를 던지거나, 동전을 던지는 등
1. Discrete probability distribution
1) 기본 개념
represent discrete random variable
sample space에 관해 각각의 확률을 갖는다.
ex) 주사위 한 개
sample space= {1,2,3,4,5,6}
probability of each outcome = 1/6 = 16.7%


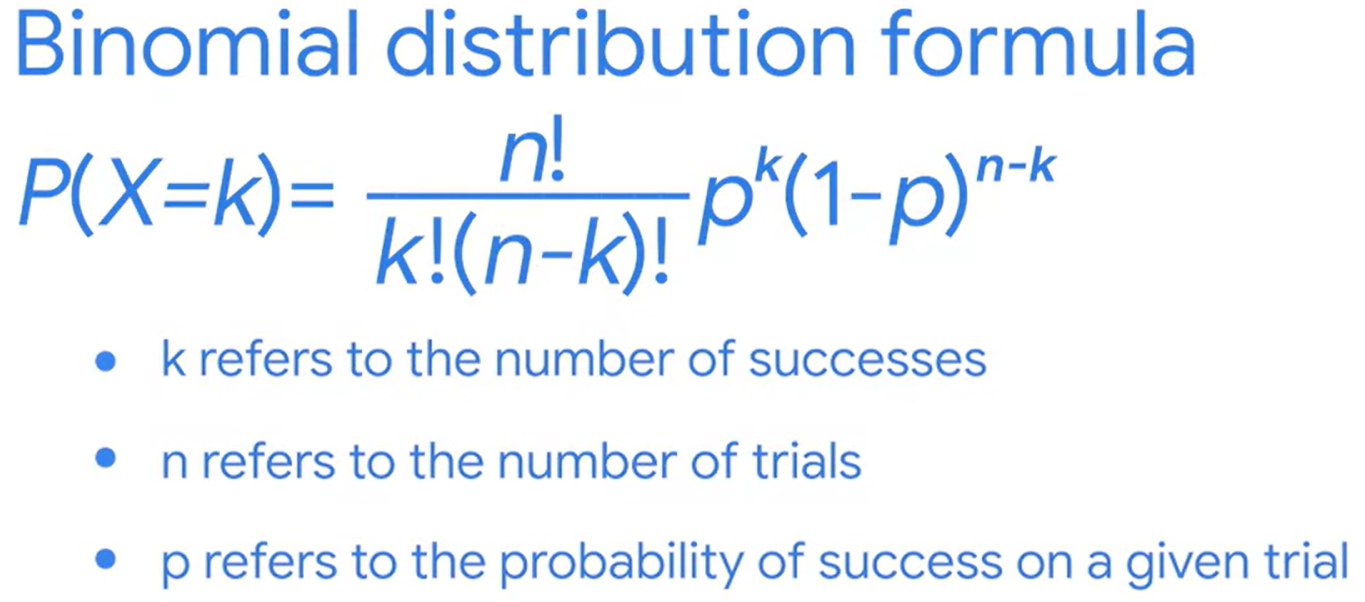
2) Binomial distribution
★ 이항분포
A discrete distribution that models the probability of events with only two possible outcomes, success or failure
성공, 실패 두 가지 경우밖에 일어나지 않을 때를 말한다.
이항분포는 아래의 경우를 가정한다.
- Each event is independent 모든 사건은 독립적이다.
- The probability of success is the same for each event 모든 경우마다 성공할 확률은 같다.
- Mutually exclusive 상호배타적이다.
- Random experiment
ex) 동전 던지기

- 베르누이 분포는 n=1일 때이다.
3) Poisson distribution
★ 포아송 분포
Models the probability that a certain number of events will occur during a specific time period or specific space such as a distance, area, volume etc
특정 시간에 따라 일어나는 사건의 발생확률
- The number of events in the experiment can be counted
- The mean number of events that occur during a specific time period is known
- Each event is independent
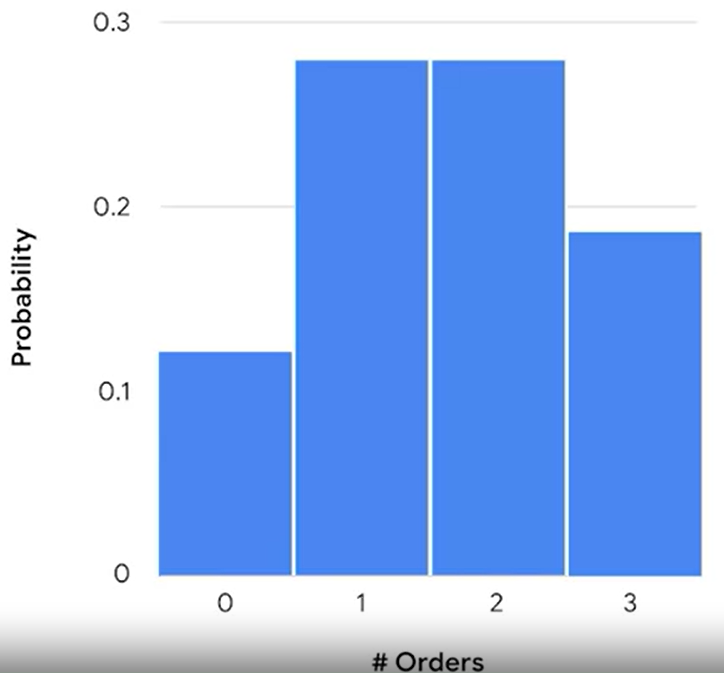
ex) 평균 1분에 2개의 주문을 받는 레스토랑이 있다. 1분에 몇 개의 주문을 받을지 구하는 확률을 구한다.


★ Poisson vs Binomial

2. Continuous probability distribution
represent continuous random variables
반면, continuous probability distribution은 각각의 확률이라는 것이 존재하지 않는다. 대신 값의 범위를 갖는다.
ex) 시간에 따라 나무가 자라나는 길이를 재어보자.
한 달마다 나무는 15, 15.2, 15.4, 15.9, 16.2 등으로 자라날 수 있다.
1) 확률 함수
확률 변수의 가능한 결과에 대한 확률을 제공하는 수학 함수이다.
두 가지 유형이 있다.
1) ★ 확률질량함수 PMF: 이산확률변수를 나타냄
2) ★ 확률밀도함수 PDF: 연속 확률변수를 나타냄 ---> 그래프로 나타남 ex) 정규분포
확률밀도 함수는 곡선의 면적으로 확률을 구한다.

2) Standard deviation 표준편차
평균값에서 변량들의 거리가 얼마나 떨어져있는지를 본다.
Calculates the typical distance of a data point from the mean of your dataset.
3) Normal distribution 정규분포
A continuous probability distribution that is symmetrical on both sides of the mean and bell-shaped.
종모양으로 가운데 평균을 기준으로 양 옆으로 대칭적으로 연속적인 확률이 분포한다.
많은 데이터들을 normal distribution으로 나타낼 수 있다.
ex) 키, 몸무게, 혈압, 월급 등

4) The Empirical rule 68-95-99.7 규칙
3시그마 규칙이라고도 한다. 데이터를 파악하는데 유용하다.

68% of values fall within 1 standard deviation of the mean
95% of values fall within 2 standard deviation of the mean
99.7% of values fall within 3 standard deviation of the mean
3. Z-scores
A measure of how many standard deviations below or above the population mean a data point is
데이터포인트가 평균으로부터 얼마나 떨어져있는지에 대해 알 수 있다.
1) z-score = 0: 그 값은 평균과 같다.
2) z-score <0 : 그 값은 평균보다 작다
3) z-score >0: 그 값은 평균보다 크다
Standardization
★ 표준화
The process of putting different variables on the same scale

위의 초록, 파랑, 빨강 데이터 정규분포는 평균값과 표준편차가 모두 다르기 때문에 서로 비교하기가 어렵다. 하지만 이 세 개의 데이터셋 모두 z-score을 가지고 있다. 따라서 z-score은 데이터를 표준화할 수 있다. z-score은 주황색 그래프와 같이 standard normal distribution에 근거하고 있기 때문에 standard scroe라고도 부른다.
standard normal distribution 표준정규분포
mean=0, standard deviation=1인 정규분포이다.
z-score은 보편적으로 -3부터 3의 범위에 있다.

예를 들어, z-score가 1이라면, 이것은 평균으로부터 한 표준편차 만큼 높은 값이다.
예를 들어, z-score가 -2라면, 이것은 평균으로부터 2표준편차 만큼 낮은 값이다.
formula
뮤= 평균
시그마= 표준편차

파이썬으로 통계하기, 모든 사진의 출처는 구글강의입니다
는 다음 시간에!