목차
1.통계 패키지
파이썬을 통계에서 하기 위해서는 두 가지 패키지를 설치한다.
1) Scipy
2) Statsmodels
from scipy import stats
import statsmodels.api as sm
데이터: 문맹률을 보여준다. overall_li가 해당 지역의 문맹률이다.

2. hist() 히스토그램
3. empirical rule 확인하기
68%, 95%, 99.7% ----> 1SD, 2SD, 3SD
1) 평균과 표준편차를 구한다.
2) 1SD
74-10 ~ 74+10
= 64~ 84
전체의 68%일까를 확인해보자.
lower_limit = mean_overall_li - 1 * std_overall_li
upper_limit = mean_overall_li + 1 * std_overall_li
68~ 84에 해당하는 구간이다.
(education_districtwise['OVERALL_LI'] >= lower_limit) & (education_districtwise['OVERALL_LI'] <= upper_limit)
전체 634개 중에서 True에 해당하는 개수가 421개이다. 퍼센티지로 나타내면 66.4로 68과 근접하다는 것을 알 수 있다.
위의 코드는 아래처럼 간단하게 나타낼 수 있다.
((education_districtwise['OVERALL_LI'] >= lower_limit) & (education_districtwise['OVERALL_LI'] <= upper_limit)).mean()
마찬가지로 2SD, 3SD도 비교하면 empirical rule이 그대로 적용되었다.
4. z-score
z-score를 알면, 데이터가 분포에 어느 정도 위치에 있는지 알게 해줘서 좋다.
1) stats.zscore()
파이썬이 모두 계산해준다.
education_districtwise['Z_SCORE'] = stats.zscore(education_districtwise['OVERALL_LI'])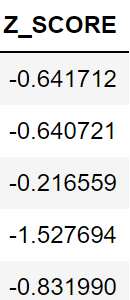
2) outlier 찾기
보통 z-score은 -3~3까지이다. 이상값을 찾을 때는 -3보다는 더 작고, 3보다는 더 큰 값을 찾으면 된다.
education_districtwise[(education_districtwise['Z_SCORE'] > 3) | (education_districtwise['Z_SCORE'] < -3)]