목차
1. Point estimate vs Interval estimate
점 추정과 구간 추정
★ 점 추정은 population에서 하나의 샘플을 추출하여 전체 값을 예측하는 것이다.
★ 구간 추정은 일정 범위의 값들을 추출하여 전체 값을 예측한다.
Confidence interval은 interval estimate라고 볼 수 있다.
점추정보다는 구간추정이 더 신뢰성이 있어 데이터분석가들이 많이 사용한다.
2. Confidence interval 신뢰구간
A range of values that describes the uncertainty surrounding an estimate
측정의 불확실성을 범위로 나타낸 값
- frequentist를 기반으로 한다.
- 임의로 추출한 각각의 값은 늘 같을 수 없고 모집단을 추정하기에 신뢰성이 낮기 때문에 confidence interval으로 신뢰성을 높이고자 신뢰구간을 데이터분석에서 많이 쓴다.
★ 요소
- sample statistic
- Margin of error
- Confidence level
< 과정>
1) Identifying a sample statistic
ex) 펭귄의 몸무게 32kg
2) Margin of error
The maximum expected difference between a population parameter and a sample estimate.
모집단의 값과 표본의 측정값과의 차이
The range of values above and below the sample statistic
샘플 사이즈가 많고, 이것이 정규분포를 따를 때 z-score과 standard error의 곱으로 구할 수도 있다.


★ z-score은 표준정규분포에서 평균으로부터 한 데이터포인트까지의 거리가 얼만큼 떨어졌는지 보여준다.
ex) z-score=1인 것은 평균으로부터 1 standard error만큼 above 된 것이다.
z-score=-2인 것은 평균으로부터 2 standard error 만큼 below 된 것이다.
3) Calculate Interval
sample statistic +- margin of error
ex) Penguins interval
sample mean = 30
margin error = 2
interval : [30-2, 30+2]= [28, 32]
4) choosing a confidence level
★ Confidence level = Cl
Describes the likelihood that a particular sampling method will produce a confidence interval that includes the population parameter.
ex) 99%, 95%, 90%
ex) 100 random samples, 95%Cl[30, 34]
예컨데 95%의 confidence level이 의미하는 바는 아래와 같다.
- 구간의 95%는 모집단의 평균과 일치한다.
- 구간의 5%는 모집단의 평균과 일치하지 않는다.
5) 예시
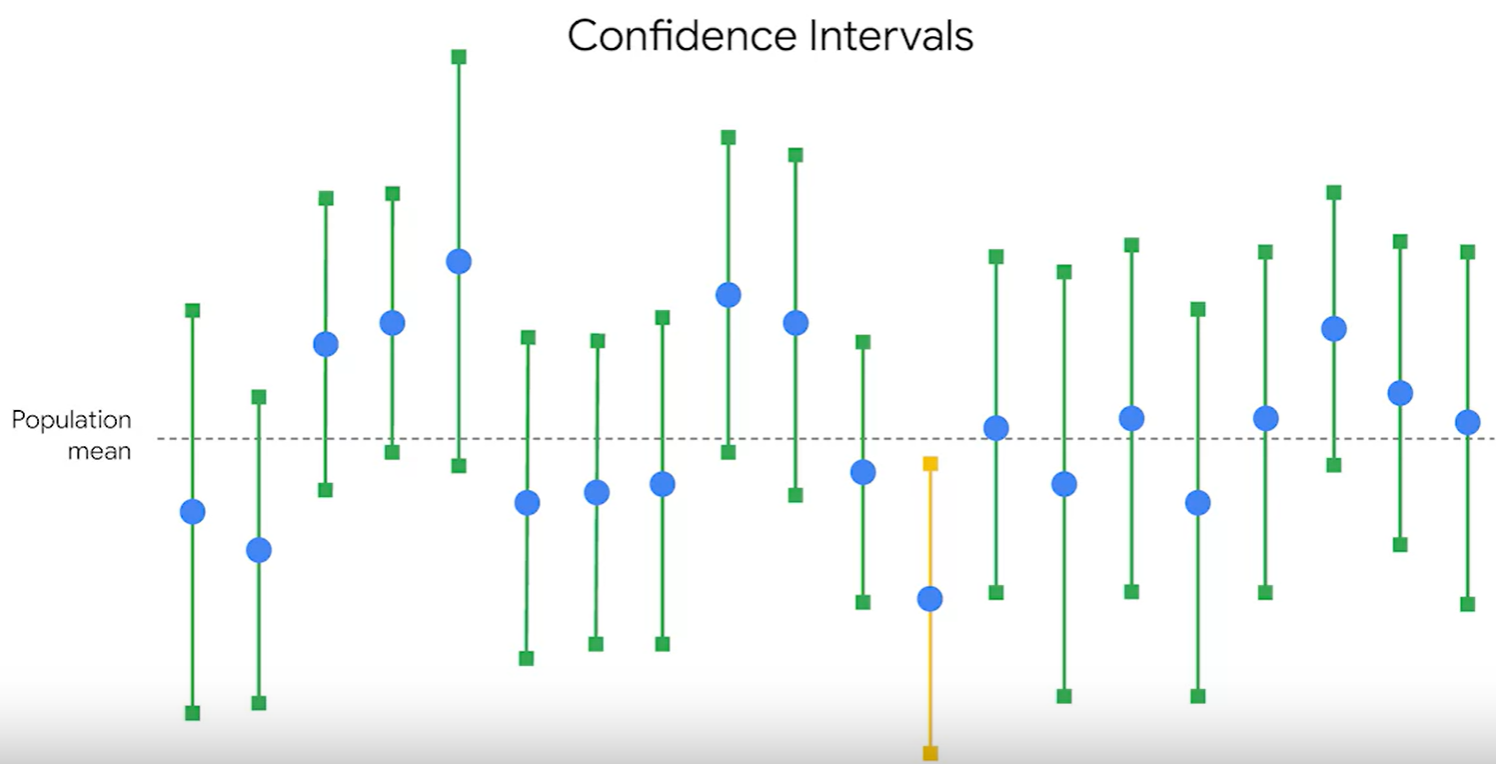
ex) 10000개의 나무 중에 50개를 샘플링해서 키를 재었다. 샘플링한 그룹 모두 평균이 다르다. 즉, sample variability가 다르다.
population mean = 51 ft

50개씩 샘플링을 총 20번했다.
아래는 샘플링한 것의 평균과 전체 모집단의 평균을 비교해놓은 것이다. 매 샘플링마다 평균이 다르다. 즉 sampling variability가 다르다.
하지만 confidence level이 95라는 말은, 20개의 샘플링 중 19개는 confidence interval 안에 들어온다는 것을 말한다.
6) misunderstanding 잘못된 해석
한 개의 신뢰구간이 미지의 모수를 포함할 확률이 95% --->X
옳은 해석: 신뢰수준 95%의 의미는 한 개의 모집단에서 동일한 방법으로 동일한 자료의 개수의 확률분포를 무한히 많이 추출하여 각 확률분포마다 신뢰구간을 구하면, 이 무한히 많은 신뢰구간 중에서 95%의 신뢰구간이 미지의 모수를 포함한다는 의미이다.
Constructing confidence intervals 신뢰구간의 설정
ex) 전교회장 선거에 alice와 jenny가 출마했다. 전교학생은 10000명이다. 그 중에서 첫 번째로 100명을 뽑아서, 누구를 뽑았는지 물어봤다. alice가 55%였다. 그렇다면 이 선거는 alice가 이겼다고 할 수 있을까?
아니다. 두 번째로 100명을 뽑았을 때도 alice가 56%였다. 세 번째도 마찬가지앋. 그런데 네 번째에는 jenny가 압도적으로 80%를 차지할 수가 있다. 이런 점추정으로는 전체 proportion을 정확히 추정하기 어렵다.
따라서, 신뢰구간을 설정해야 한다.
1. proportion
< Steps for constructing a confidence interval >
sample proportion=0.55
1. Identify a sample statistic: proportion
2. Choose a confidence level : 95%
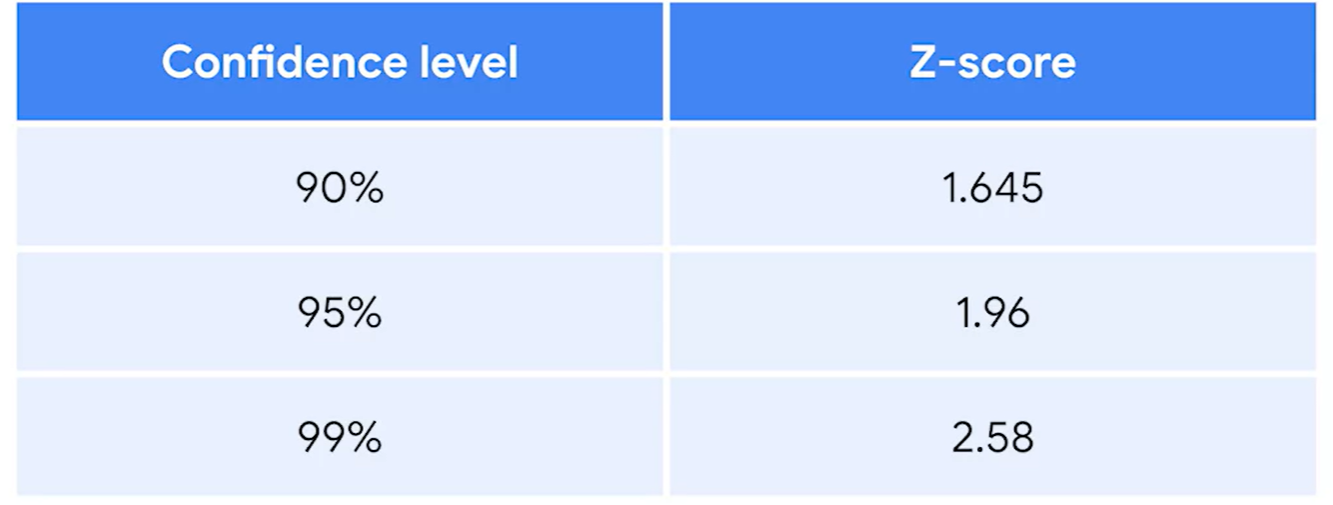
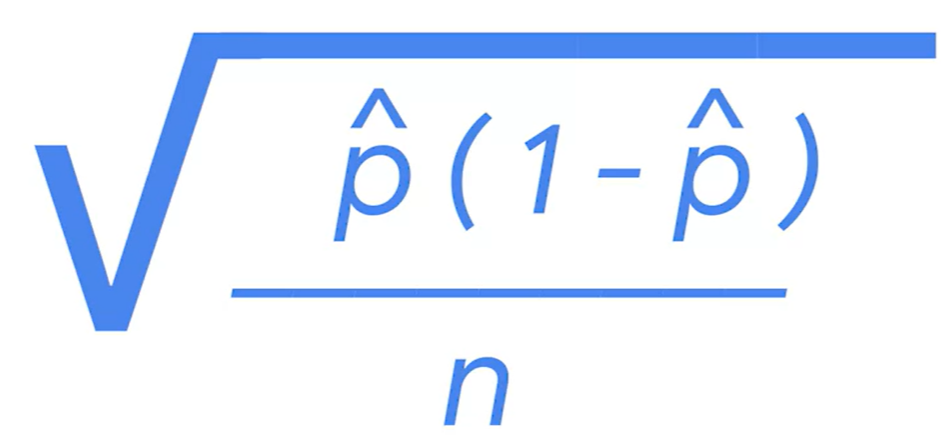
3. Find the margin of error : z-score *SD = 1.96*0.05=0.098
95%에 대한 z-score= 1.96
SD=standard error of the proportion =0.05
4. Calculate the interval: 95% Cl [45.2, 64.8]
sample proportion=0.55
upper limit= sample proportion + margin of error
lower limit= sample proportion - margin of error
[ 0.55-0.098, 0.55+0.098 ]
n의 개수를 많이하면, margin of error가 작아져서, 신뢰구간이 짧아진다.
2. mean
< Steps for constructing a confidence interval >
ex) 휴대폰 배터리 유지 시간에 대해 신뢰구간을 추정해보자.
population 10000 cellphone battery
sample 100개
sample mean 20.5hrs
sample standard deviation 1.7 hrs
population standard deviation 1.5hrs
1. Identify a sample statistic: mean
2. Choose a confidence level : 95%
3. Find the margin of error : z-score *SD = 1.96*0.15-0.294
95%에 대한 z-score= 1.96
SD=standard error of the mean =0.15

4. Calculate the interval: 95% Cl [20:12, 20:48]
upper limit= sample proportion + margin of error
lower limit= sample proportion - margin of error
[ 20.5-0.294, 20.5+0.294 ]
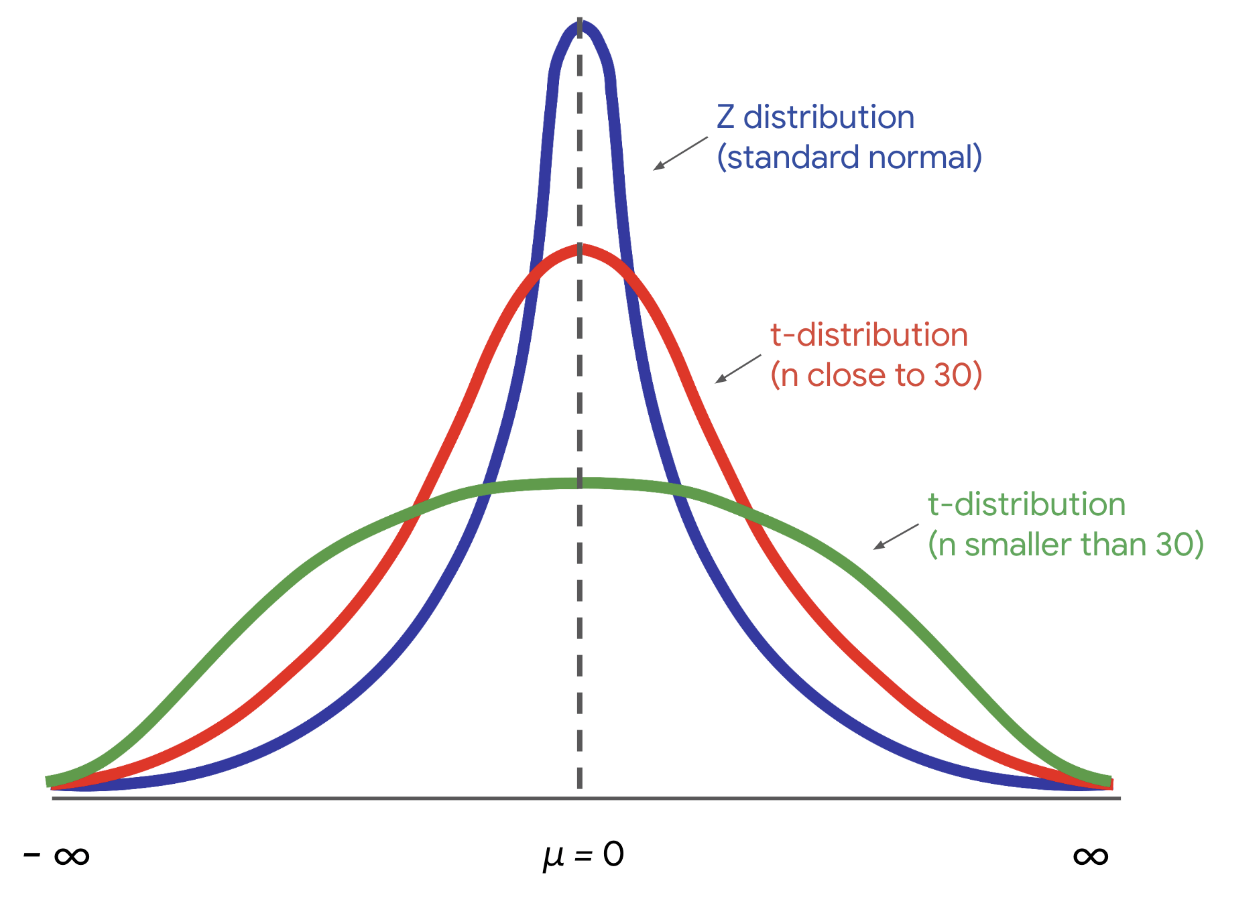
T 분포
소규모 샘플인 경우, 즉 표본 크기가 작은 경우에 t 분포를 쓴다.
z분포(표준정규분포)와 비슷한 종 모양을 가지나, 이상값의 빈도가 더 높기 때문에 꼬리가 더 크다.
샘플 크기가 30에 도달하면 분포가 실질적으로 동일하며 계산에 정규 분포를 사용할 수 있다.
자유도= 샘플크기 -1