목차
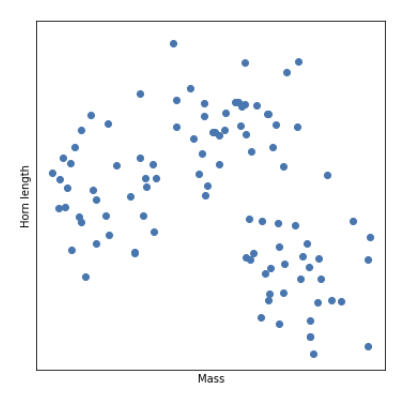
K-means models
- Unsupervised learning(using unlabled data)
- Partitioning algorithm
- Clusters unlabeled data
- centroid : each cluster is defined by a central point or a centroid that is center of a cluster determined by the mathematical mean of all the points in that cluster. 그래서 이름이 k-means이다.
군집화에서 가장 일반적으로 사용하는 알고리즘으로, centroid(중심점)을 임의로 선택해 이와 가장 가까운 포인트들을 선택하는 방법이다.
- metrics : inertia, silhouette score
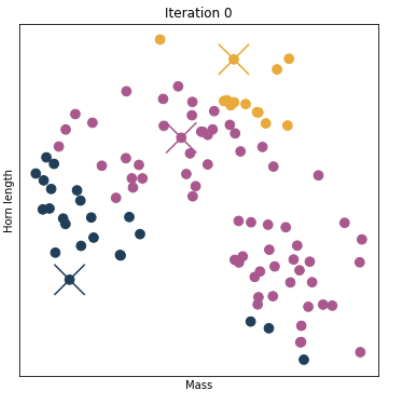
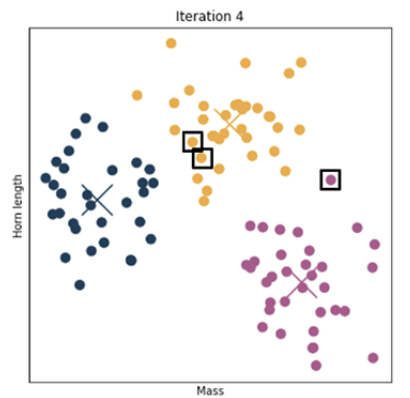
<procedure>
성능이 안좋은 clustering이 될 수 있으므로, 여러 개의 모델을 만드는 것이 필요하다.
1. centroid 개수 정하고 아무데나 놓기
k는 모델에서 centroid의 개수를 뜻한다. 모델 개발자가 정한다. 만약에 개수를 잘 모르겠다면 여러 개를 시도한 다음 가장 적절한 것으로 고르면 된다.
2. 데이터들을 가장 가까운 centroid로 배정한다.
3. 각각의 centroid에 모인 데이터들의 평균값을 계산해서, centroid를 새로운 위치로 옮긴다.
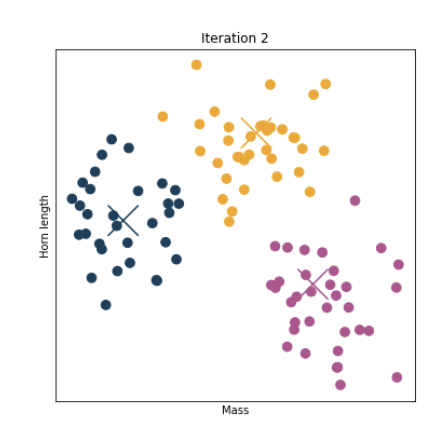
4. 2~3번 과정을 더이상 데이터 포인트가 이동하지 않을 때까지 계속 반복한다.
Python
1. 라이브러리
import numpy as np
import pandas as pd

%pylab inline
import plotly.graph_objects as go

from sklearn.cluster import KMeans
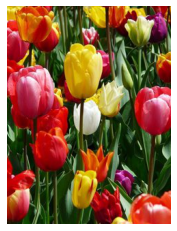
2. plt.imread
img = plt.imread('using_kmeans_for_color_compression_tulips_photo.jpg')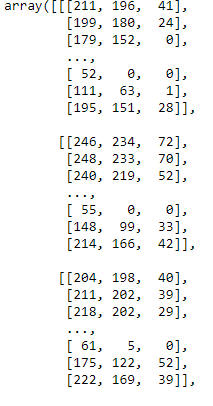
matplotlib.pyplot 모듈에서 사용한다. imread함수는 이미지 파일을 읽어 numpy 배열로 변환하여 이미지 데이터를 제공한다.
3. plt.axis
plt.imshow(img)
plt.axis('off');
plt.axis('off')는 matplotlib.pyplot 모듈에서 사용하며, matplotlib 그래프의 축을 숨기는 역할을 한다.
4. shape, reshape
img.shape--> (320, 240,3)
이 이미지는 320 *240* 3의 모양을 갖는다.
이미지는 픽셀로 이루어져 있다.
세로 320개의 픽셀, 가로 240개의 픽셀, r,g,b 채널 3개 이다.
img_flat = img.reshape(img.shape[0]*img.shape[1], 3)이미지의 모양을 바꾼다. 가로 세로를 합쳐서 이미지를 flatten한다.
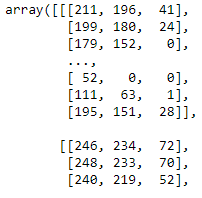
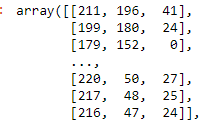
img_flat.shape(76800, 3)
5. 데이터프레임으로 바꾸기
img_flat_df = pd.DataFrame(img_flat, columns = ['r', 'g', 'b'])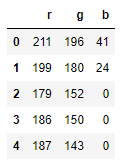
6. scatter그래프로 바꾸기
trace = go.Scatter3d(x = img_flat_df.r,
                     y = img_flat_df.g,
                     z = img_flat_df.b,
                     mode='markers',
                     marker=dict(size=1,
                                 color=['rgb({},{},{})'.format(r,g,b) for r,g,b
                                        in zip(img_flat_df.r.values,
                                               img_flat_df.g.values,
                                               img_flat_df.b.values)],
                                 opacity=0.5))

data = [trace]

layout = go.Layout(margin=dict(l=0,
                               r=0,
                               b=0,
                               t=0),
                               )

fig = go.Figure(data=data, layout=layout)
fig.update_layout(scene = dict(
                    xaxis_title='R',
                    yaxis_title='G',
                    zaxis_title='B'),
                  )
fig.show()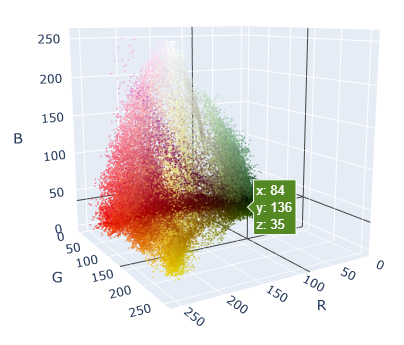
7. centroid 3개, k-means 모델링
kmeans3 = KMeans(n_clusters=3, random_state=42).fit(img_flat)
np.unique(kmeans3.labels_)
array([0, 1, 2], dtype=int32)
8. 중심 좌표
centers = kmeans3.cluster_centers_array([[ 40.7359554 , 50.52854867, 16.24875942],
[177.531583 , 41.76184109, 27.36574693],
[202.22533765, 173.65952858, 109.69783803]])
9. 기타 정보
print(kmeans3.labels_.shape)
print(kmeans3.labels_)
print(np.unique(kmeans3.labels_))
print(kmeans3.cluster_centers_)
(76800,)
[2 2 1 ... 1 1 1]
[0 1 2]
[[ 40.7359554 50.52854867 16.24875942]
[177.531583 41.76184109 27.36574693]
[202.22533765 173.65952858 109.69783803]]
9. 중심이 나타내는 색깔 보기
def show_swatch(RGB_value):
    R, G, B = RGB_value
    rgb = [[np.array([R,G,B]).astype('uint8')]]
    plt.figure()
    plt.imshow(rgb)
    plt.axis('off');

for pixel in centers:
    show_swatch(pixel)
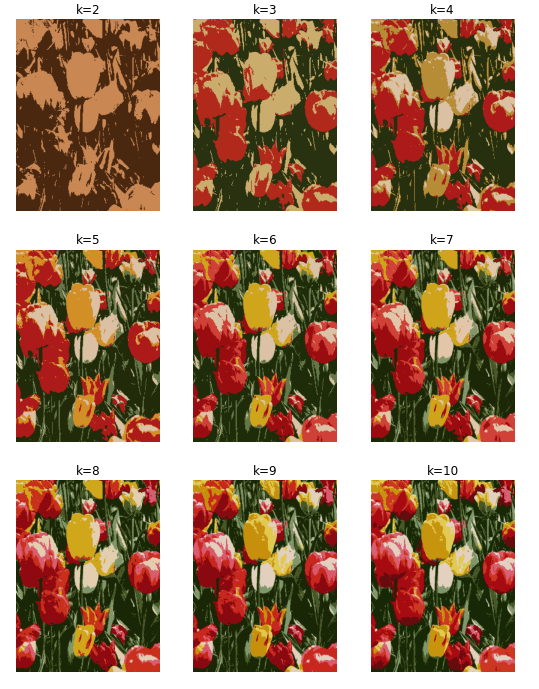
10. centroid 개수를 반영한 이미지
def cluster_image(k, img=img):
    img_flat = img.reshape(img.shape[0]*img.shape[1], 3)
    kmeans = KMeans(n_clusters = k, random_state = 42).fit(img_flat)
    new_img = img_flat.copy()

    for i in np.unique(kmeans.labels_):
        new_img[kmeans.labels_ == i, :] = kmeans.cluster_centers_[i]

    new_img = new_img.reshape(img.shape)

    return plt.imshow(new_img), plt.axis('off');
11. 시각화
1) 데이터프레임에 넣기
img_flat_df['cluster'] = kmeans3.labels_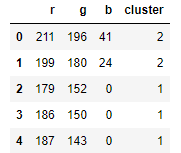
2) 딕셔너리 만들기
series_conversion = {0: 'rgb' +str(tuple(kmeans3.cluster_centers_[0])),
                     1: 'rgb' +str(tuple(kmeans3.cluster_centers_[1])),
                     2: 'rgb' +str(tuple(kmeans3.cluster_centers_[2])),
                     }
series_conversion
{0: 'rgb(40.735955400323704, 50.528548673661014, 16.248759419210476)',
1: 'rgb(177.5315829990752, 41.76184109234782, 27.36574693083339)',
2: 'rgb(202.2253376469871, 173.65952857804268, 109.69783803213303)'}
3) 데이터 값 바꾸기
img_flat_df['cluster'] = img_flat_df['cluster'].map(series_conversion)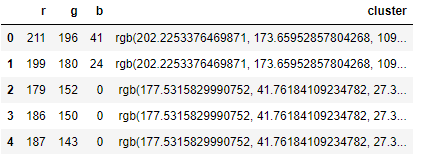
4) scatter 3d plot
trace = go.Scatter3d(x = img_flat_df.r,
                     y = img_flat_df.g,
                     z = img_flat_df.b,
                     mode='markers',
                     marker=dict(size=1,
                                 color=img_flat_df.cluster,
                                 opacity=1))

data = trace

layout = go.Layout(margin=dict(l=0,
                               r=0,
                               b=0,
                               t=0))

fig = go.Figure(data=data, layout=layout)
fig.show()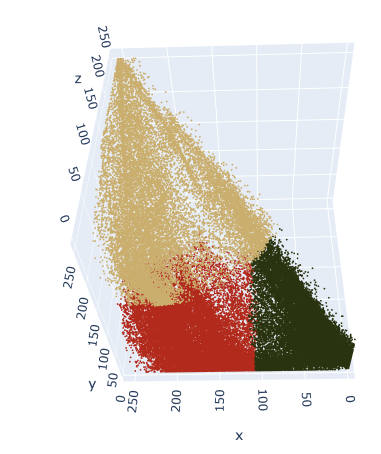
5) k개수 변화
# Helper function to plot image grid
def cluster_image_grid(k, ax, img=img):
    img_flat = img.reshape(img.shape[0]*img.shape[1], 3)
    kmeans = KMeans(n_clusters=k, random_state=42).fit(img_flat)
    new_img = img_flat.copy()

    for i in np.unique(kmeans.labels_):
        new_img[kmeans.labels_==i, :] = kmeans.cluster_centers_[i]

    new_img = new_img.reshape(img.shape)
    ax.imshow(new_img)
    ax.axis('off')

fig, axs = plt.subplots(3, 3)
fig = matplotlib.pyplot.gcf()
fig.set_size_inches(9, 12)
axs = axs.flatten()
k_values = np.arange(2, 11)
for i, k in enumerate(k_values):
    cluster_image_grid(k, axs[i], img=img)
    axs[i].title.set_text('k=' + str(k))